
Home >Web Front-end >JS Tutorial >How to implement echart chart effect in angularjs
How to implement echart chart effect in angularjs
- 亚连Original
- 2018-06-23 15:58:141946browse
This article mainly introduces the most concise tutorial on how to achieve the echart chart effect in angularjs. The editor thinks it is quite good, so I will share it with you now and give it as a reference. Let’s follow the editor and take a look.
This article introduces the most concise tutorial on how to implement the echart chart effect in angularjs. I would like to share it with you. The details are as follows:
ehcart is a data chart made by Baidu, based on native js. The interface and configuration are well written and easy to read, and can also be used for commercial purposes.
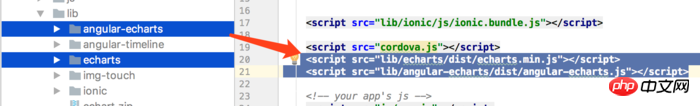
1 echart package reference
Download, unzip and put it into lib.
Download address: echart_jb51.rar
And reference the two js files as shown in the index.html.
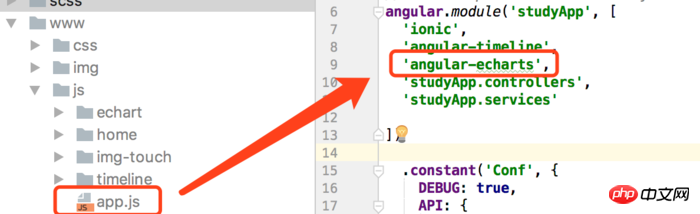
Quoting angular-echarts in app.js
##Second page
html page<!--饼图--> <p> <donut-chart config="donutConfig" data="dataList.incomeData"> </donut-chart> </p>
<!--柱状图-->
 <p id="id0001" style="width: 100%;height: 400px; padding: 0;margin: 0; border-width: 0; ">
 </p>
controller
/**
* Created by xiehan on 2017/11/29.
*/
angular.module('studyApp.controllers')
.controller('EchartCtrl', function ($scope, $rootScope, $ionicHistory,$location) {
$scope.title = 'echart图表';
/*
官方实例链接:http://echarts.baidu.com/examples.html
*/
$scope.goBack = function () {
$ionicHistory.goBack();
};
//用于数据的格式化
$scope.dataList = {
incomeData:""
};
// 饼图
$scope.pieConfig = {};
// 环形图
$scope.donutConfig = {};
init();
function init() {
initChartsConfig();
initIncome();
initConfigChart();
}
//饼图配置初始化
function initChartsConfig() {
$scope.pieConfig = {
center: [120, '50%'],
radius: 90
};
$scope.donutConfig = {
radius: [0, 90]
};
}
//饼图数据
function initIncome(){
var temp = [
{
NAME:"测试1",
NUM:11
},
{
NAME:"测试2",
NUM:22
},
{
NAME:"测试3",
NUM:33
},
{
NAME:"测试4",
NUM:44
}
];
if (temp) {
// 处理数据
var temp2 = [];
angular.forEach(temp, function (item) {
var t = {x: item.NAME, y: item.NUM};
temp2.push(t);
});
$scope.dataList.incomeData = [{
name: 'echart饼图测试',
datapoints: temp2
}];
}
}
//柱状图数据
function initConfigChart() {
var parkaccountChart = echarts.init(document.getElementById('id0001'));//p 标签id
var seriesLabel = {
normal: {
show: true,
textBorderColor: '#333',
textBorderWidth: 2
}
};
var option = {
tooltip: {
trigger: 'axis',
axisPointer: {
type: 'shadow'
}
},
legend: {
data: ['总数1', '总数2', '总数3'],
bottom:true
},
grid: {
left: '1%',
right: '4%',
bottom: '8%',
top:'5%',
containLabel: true
},
xAxis: {
type: 'value',
name: '',
axisLabel: {
formatter: '{value}'
}
},
yAxis: {
type: 'category',
inverse: true,
data: ['y1', 'y2', 'y3']
},
series: [
{
name: '总数1',
type: 'bar',
label: seriesLabel,
data: [165, 170, 330]
},
{
name: '总数2',
type: 'bar',
label: seriesLabel,
data: [150, 105, 110]
},
{
name: '总数3',
type: 'bar',
label: seriesLabel,
data: [220, 82, 63]
}
]
};
parkaccountChart.setOption(option);
}
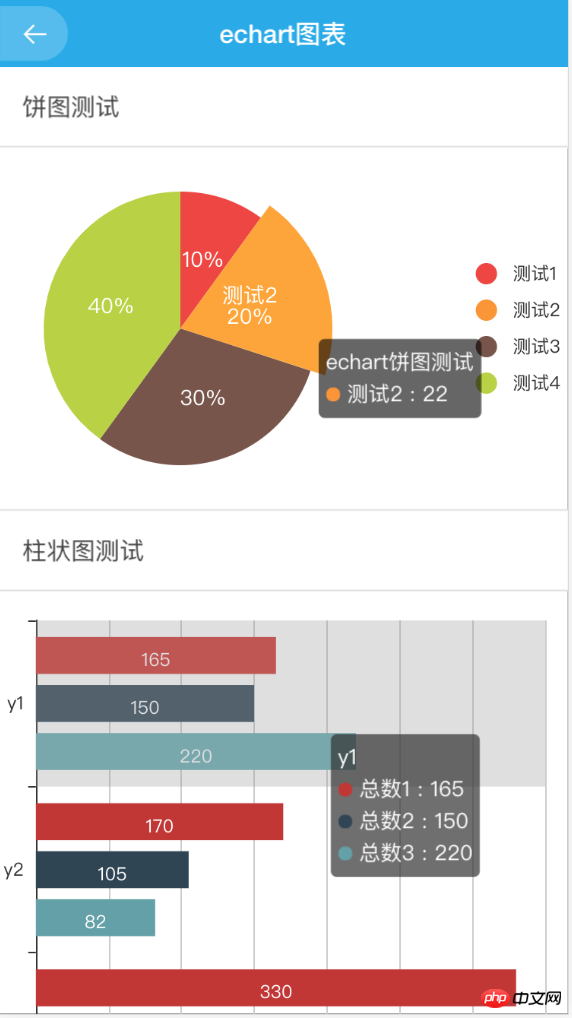
});Rendering
What are the special data types in JavaScript
##How to achieve left and right sliding in WeChat mini programBuild React Webpack desktop application using Electron (detailed tutorial)How to bind Json data source using EasyUIUse angular to write the Message componentThe above is the detailed content of How to implement echart chart effect in angularjs. For more information, please follow other related articles on the PHP Chinese website!
Related articles
See more- An in-depth analysis of the Bootstrap list group component
- Detailed explanation of JavaScript function currying
- Complete example of JS password generation and strength detection (with demo source code download)
- Angularjs integrates WeChat UI (weui)
- How to quickly switch between Traditional Chinese and Simplified Chinese with JavaScript and the trick for websites to support switching between Simplified and Traditional Chinese_javascript skills