Home >Web Front-end >JS Tutorial >How to use Echarts charts in Angular2.0/4.0
How to use Echarts charts in Angular2.0/4.0
- 亚连Original
- 2018-06-22 13:57:252238browse
This article mainly introduces the sample code for using Echarts in Angular2.0/4.0. The editor thinks it is quite good, so I will share it with you now and give it as a reference. Let’s follow the editor and have a look
Preface: During development, we now need to use echarts to make icons, so I searched for information on the Internet and finally found that the ngx-echarts wheel is available. Then let’s take a step.
Method: Use echarts and ngx-eachrts as two dependencies, with the help of ngx.., because echarts is written based on js and does not have ts files. So just use ngx-echarts.
Step 1: Install dependencies
npm install echarts --save
npm install ngx-echarts --save
Step 2: Introduction in Module
import { NgxEchartsModule } from 'ngx-echarts';
@NgModule({
 imports: [
 ...,
// 引入module
 NgxEchartsModule
 ],
})
export class AppModule { }
Step 3: Add js to angular-cli to introduce
// edit .angular-cli.json
{
 "scripts": [
 // add this: 注意,在echarts中可能没有提供echarts.min.js但是肯定有echarts.js的。对应引入即可。
 "../node_modules/echarts/dist/echarts.min.js"
// 还可以添加中英文,主题。。。。
 ],
}
Step 4: Use
<p echarts [options]="options" [loading]="isLoading" class="demo-chart"></p>
Various files
. html
<p echarts [options]="options" class="demo-chart"></p>
. ts
options: any;
constructor() { }
ngOnInit() {
let xAxisData = [];
let data1 = [];
let data2 = [];
for (let i = 0; i < 100; i++) {
xAxisData.push('category' + i);
data1.push((Math.sin(i / 5) * (i / 5 - 10) + i / 6) * 5);
data2.push((Math.cos(i / 5) * (i / 5 - 10) + i / 6) * 5);
}
this.options = {
legend: {
data: ['bar', 'bar2'],
align: 'left'
},
tooltip: {},
xAxis: {
data: xAxisData,
silent: false,
splitLine: {
show: false
}
},
yAxis: {
},
series: [{
name: 'bar',
type: 'bar',
data: data1,
animationDelay: function (idx) {
return idx * 10;
}
}, {
name: 'bar2',
type: 'bar',
data: data2,
animationDelay: function (idx) {
return idx * 10 + 100;
}
}],
animationEasing: 'elasticOut',
animationDelayUpdate: function (idx) {
return idx * 5;
}
};
}. AppModule will not be described here
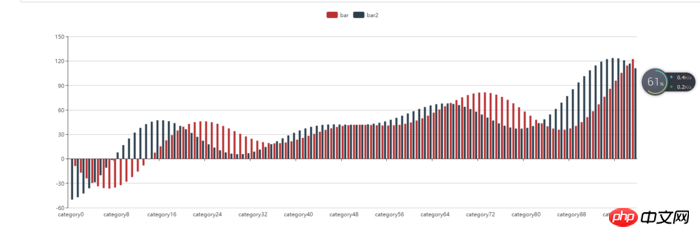
Final result:

Finally
Of course, the official website of ngx-echarts is attached, above. The examples are actually just examples from the official website.
I saw on the Internet that some people also use this component, but it is an older version, so I wrote one myself and am using it.
Of course, events are required, and others can be viewed on the official website. Because I am just using it, specific problems require specific analysis. So I won’t go into details about the rest.
Problems encountered during use?
I use the background framework of ng2-admin. In this framework, NgxEchartsModule cannot be introduced in AppModule.ts. The specific reason is unknown, but it is speculated to be caused by ng2-admin.
The above is what I compiled for everyone. I hope it will be helpful to everyone in the future.
Related articles:
How to install nvm on Mac (detailed tutorial)
About the mobile phone touch screen sliding function in jquery
How to implement delayed loading of images using dataset
How to implement two-way data binding in Angular
The above is the detailed content of How to use Echarts charts in Angular2.0/4.0. For more information, please follow other related articles on the PHP Chinese website!
Related articles
See more- An in-depth analysis of the Bootstrap list group component
- Detailed explanation of JavaScript function currying
- Complete example of JS password generation and strength detection (with demo source code download)
- Angularjs integrates WeChat UI (weui)
- How to quickly switch between Traditional Chinese and Simplified Chinese with JavaScript and the trick for websites to support switching between Simplified and Traditional Chinese_javascript skills

