Home >Web Front-end >JS Tutorial >How to use highcharts correctly in angular
How to use highcharts correctly in angular
- 小云云Original
- 2018-02-05 10:34:331892browse
This article mainly introduces to you the sample code for using highcharts in angular. It is of great practical value. Friends who need it can refer to it. I hope it can help everyone.
Install dependencies
##
npm install highcharts-ng --saveIntroduce dependencies
##
'highcharts/highcharts.src.js',
'highcharts-ng/dist/highcharts-ng.min.js'
Inject dependencies
var myapp = angular.module('myapp', ["highcharts-ng"]);
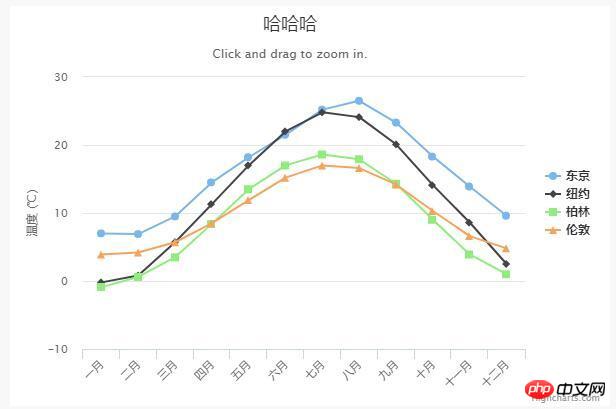
Instance
// html
<highchart class="chart" config="chartConfig" class="span9" ></highchart>
// js
$scope.chartConfig = {
title: {
text: '哈哈哈',
x: -20
},
subtitle: {
text: 'Click and drag to zoom in.',
x: -20
},
xAxis: {
categories: ['一月', '二月', '三月', '四月', '五月', '六月', '七月', '八月', '九月', '十月', '十一月', '十二月']
},
yAxis: {
title: {
text: '温度 (°C)'
},
plotLines: [{
value: 0,
width: 1,
color: '#808080'
}]
},
tooltip: {
valueSuffix: '°C'
},
legend: {
layout: 'vertical',
align: 'right',
verticalAlign: 'middle',
borderWidth: 0
},
series: [{
name: '东京',
data: [7.0, 6.9, 9.5, 14.5, 18.2, 21.5, 25.2, 26.5, 23.3, 18.3, 13.9, 9.6]
}, {
name: '纽约',
data: [-0.2, 0.8, 5.7, 11.3, 17.0, 22.0, 24.8, 24.1, 20.1, 14.1, 8.6, 2.5]
}, {
name: '柏林',
data: [-0.9, 0.6, 3.5, 8.4, 13.5, 17.0, 18.6, 17.9, 14.3, 9.0, 3.9, 1.0]
}, {
name: '伦敦',
data: [3.9, 4.2, 5.7, 8.5, 11.9, 15.2, 17.0, 16.6, 14.2, 10.3, 6.6, 4.8]
}]
};Result
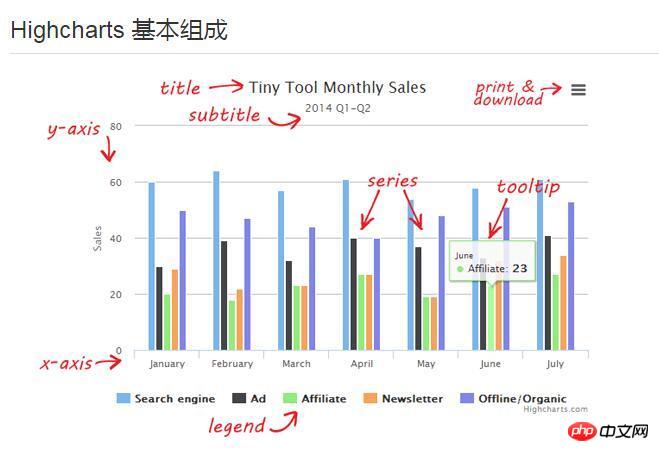
Basic composition of Highcharts
Related recommendations: 
HighCharts drawing 2D line chart with Label effect example sharing
Detailed explanation on how to dynamically transfer data to highcharts through php
PHP+mysql+Highcharts to implement pie chart_PHP tutorial
The above is the detailed content of How to use highcharts correctly in angular. For more information, please follow other related articles on the PHP Chinese website!
Statement:
The content of this article is voluntarily contributed by netizens, and the copyright belongs to the original author. This site does not assume corresponding legal responsibility. If you find any content suspected of plagiarism or infringement, please contact admin@php.cn
Previous article:How to use the Array.includes() function in ES6Next article:How to use the Array.includes() function in ES6
Related articles
See more- An in-depth analysis of the Bootstrap list group component
- Detailed explanation of JavaScript function currying
- Complete example of JS password generation and strength detection (with demo source code download)
- Angularjs integrates WeChat UI (weui)
- How to quickly switch between Traditional Chinese and Simplified Chinese with JavaScript and the trick for websites to support switching between Simplified and Traditional Chinese_javascript skills

