
Home >Web Front-end >JS Tutorial >Sharing examples of creating logistics maps with D3.js
Sharing examples of creating logistics maps with D3.js

- 小云云Original
- 2018-01-29 09:11:362426browse
This article mainly introduces the sample code for creating a logistics map using D3.js. The editor thinks it is quite good, so I will share it with you now and give it as a reference. Let’s follow the editor to take a look, I hope it can help everyone.
Example map
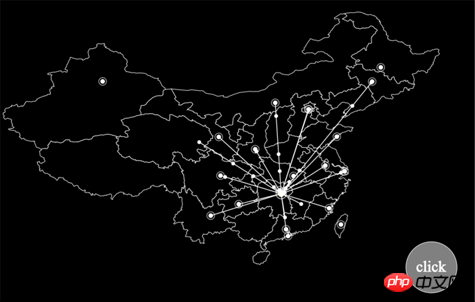
Production ideas
Need to draw a map of China, as background.
The latitude and longitude coordinates of major cities are required to draw the starting and ending points of road sheets.
The city that receives the logistics order draws a flashing mark.
The target city that already has a logistics order will no longer draw a route.
Every time a new logistics order is generated, there will be an animation effect of the mark moving along the route to the target.
The data after drawing needs to be cleaned up to reduce the resource usage of the browser.
Start coding
1. Create a web page template
Load D3JS for easy debugging , directly download the d3.js file locally. When actually using it, you can change it to the loading path. Note that the V4 version of D3 is used, which is different from the V3 version.
Create a p-block and prepare it for drawing.
<!DOCTYPE html>
<html lang="en">
  <head>
    <meta charset="utf8">
    <script type="text/javascript" src="../../static/d3/d3.js"></script>
    <title>地图</title>
  </head>
  <body>
    <p class="fxmap">
    </p>
  </body>
  <script type="text/javascript"></script>
</html>
Create SVG, place all the following codes in 3f1c4e4b6b16bbbd69b2ee476dc4f83a2cacc6d41bbb37262a98f745aa00fbf0
##
var width=1000 , height=800; // 定义SVG宽高
var svg = d3.select("body p.fxmap")
            .append("svg")
            .attr("width", "width)
            .attr("height", height)
            .style("background","#000"); //
Create SVG graphics grouping in preparation for calling
- gmp and save the background map and starting point mark.
- mline, saves the connection between the starting point and the target, as well as the target point.
- button, button for testing
gmap = svg.append("g").attr("id", "map").attr("stroke", "white").attr("stroke-width",1);
    mline = svg.append("g").attr("id", "moveto").attr("stroke", "#FFF").attr("stroke-width", 1.5).attr("fill","#FFF");
    button = svg.append("g").attr("id", "button").attr("stroke", "white").attr("stroke-width", 1).attr("fill", "white");
Create projection function
- Longitude and latitude cannot be used directly for drawing and need to be converted into plane coordinates. d3js provides a relatively rich range of projection methods. In this example, the geoEquirectangular() method is used.
- projection is a method for converting longitude and latitude into plane coordinates
- path is a method for converting longitude and latitude into line drawing point coordinates (save yourself Then write the function to construct the path path)
var projection = d3.geoEquirectangular()
              .center([465,395]) // 指定投影中心,注意[]中的是经纬度
              .scale(height)
              .translate([width / 2, height / 2]);
var path = d3.geoPath().projection(projection);
Create a marker so that multiple connection endpoints can be called
- Since there will be multiple endpoints of the logistics line, they are all called in a marker.
- This mark is composed of a middle circle + an outer ring. The flashing effect of the outer ring is created separately.
marker = svg.append("defs")
          .append("marker")
          .append("marker")
          .attr("id", "pointer")
          .attr("viewBox","0 0 12 12")  // 可见范围
          .attr("markerWidth","12")    // 标记宽度
          .attr("markerHeight","12")    // 标记高度
          .attr("orient", "auto")     //
          .attr("markerUnits", "strokeWidth") // 随连接线宽度进行缩放
          .attr("refX", "6")       // 连接点坐标
          .attr("refY", "6")
    // 绘制标记中心圆
    marker.append("circle")
        .attr("cx", "6")
        .attr("cy", "6")
        .attr("r", "3")
        .attr("fill", "white");
    // 绘制标记外圆,之后在timer()中添加闪烁效果
    marker.append("circle")
        .attr("id", "markerC")
        .attr("cx", "6")
        .attr("cy", "6")
        .attr("r", "5")
        .attr("fill-opacity", "0")
        .attr("stroke-width", "1")
        .attr("stroke", "white");
Draw a map of China and mark the starting point (Changsha)
The longitude and latitude set used in the map is china.json, there are many// 记录长沙坐标
var changsha = projection([112.59,28.12]);
// 读取地图数据,并绘制中国地图
mapdata = [];
d3.json('china.json', function(error, data){
if (error)
console.log(error);
// 读取地图数据
mapdata = data.features;
// 绘制地图
gmap.selectAll("path")
.data(mapdata)
.enter()
.append("path")
.attr("d", path);
// 标记长沙
gmap.append("circle").attr("id","changsha")
.attr("cx", changsha[0])
.attr("cy", changsha[1])
.attr("r", "6")
.attr("fill", "yellow")
gmap.append("circle").attr("id","changshaC")
.attr("cx", changsha[0])
.attr("cy", changsha[1])
.attr("r", "10")
.attr("stroke-width", "2")
.attr("fill-opacity", "0");
});
creation methods on this file, draw a connection line from the specified starting point to the end point, and draw it at the network point marker mark.
- The method requires inputting the destination city name (city) and latitude and longitude (data)
- Call the previously established project() method. Convert the end point latitude and longitude into plane coordinates.
- Calculate the distance between the starting point (Changsha) and the end point as line length and animation time parameters.
- Draw a circular mark on the line and animate the movement from the starting point to the end point.
- After the mark is moved to the end point, it will be deleted to save resources.
- If the line point has been drawn before, no line will be drawn, only the moving mark will be drawn.
- Every time a logistics order is processed, the city record will be +1.
// 创建对象,保存每个城市的物流记录数量
    var citylist = new Object();
    // 创建方法,输入data坐标,绘制发射线
    var moveto = function(city, data){
      var pf = {x:projection([112.59,28.12])[0], y:projection([112.59,28.12])[1]};
      var pt = {x:projection(data)[0], y:projection(data)[1]};
      var distance = Math.sqrt((pt.x - pf.x)**2 + (pt.y - pf.y)**2);
      if (city in citylist){
        citylist[city]++;
      }else{
        mline.append("line")
            .attr("x1", pf.x)
            .attr("y1", pf.y)
            .attr("x2", pt.x)
            .attr("y2", pt.y)
            .attr("marker-end","url(#pointer)")
            .style("stroke-dasharray", " "+distance+", "+distance+" ")
            .transition()
            .duration(distance*30)
            .styleTween("stroke-dashoffset", function(){
              return d3.interpolateNumber(distance, 0);
            });
        citylist[city] = 1;
      };
      mline.append("circle")
        .attr("cx", pf.x)
        .attr("cy", pf.y)
        .attr("r", 3)
        .transition()
        .duration(distance*30)
        .attr("transform", "translate("+(pt.x-pf.x)+","+(pt.y-pf.y)+")")
        .remove();
    };
Create an animation queue instance to achieve the flashing effect of the outer circle of the mark
var scale = d3.scaleLinear();
    scale.domain([0, 1000, 2000])
      .range([0, 1, 0]);
    var start = Date.now();
    d3.timer(function(){
      var s1 = scale((Date.now() - start)%2000);
      // console.log(s1);
      gmap.select("circle#changshaC")
        .attr("stroke-opacity", s1);
      marker.select("circle#markerC")
        .attr("stroke-opacity", s1);
    });
Create test button and test target city data
var cityordinate = {
      '哈尔滨':[126.5416150000,45.8088260000],
      '石家庄':[116.46,39.92],
      '北京':[116.39564503787867,39.92998577808024],
      '上海':[121.480539,31.235929],
      '广州':[113.271431,23.135336],
      '重庆':[106.558434,29.568996],
      '青岛':[120.38442818368189,36.10521490127382],
      '福州':[119.30347,26.080429],
      '兰州':[103.840521,36.067235],
      '贵阳':[106.636577,26.653325],
      '成都':[104.081534,30.655822],
      '西安':[108.946466,34.347269],
      '长春':[125.3306020000,43.8219540000],
      '台湾':[120.961454,23.80406],
      '呼和浩特':[111.7555090000,40.8484230000],
      '澳门':[113.5494640000,22.1929190000],
      '武汉':[114.3115820000,30.5984670000],
      '昆明':[102.71460113878045,25.049153100453159],
      '乌鲁木齐':[87.56498774111579,43.84038034721766],
      '益阳':[112.36654664522563,28.58808777988717],
      '南京':[118.77807440802562,32.05723550180587],
      '武昌':[114.35362228468498,30.56486029278519],
    };

    // 随机获得目标城市
    var cityname = [], total = 0;
    for (var key in cityordinate){
      cityname[total++] = key;
    };

    // 创建操作按钮,每次点击发射一条物流线
    button.append("circle")
        .attr("cx", width*0.9)
        .attr("cy", height*0.8)
        .attr("r", width/20)
        .attr("text","click")
        .attr("fill", "grey");
    button.append("text")
        .attr("x", width*0.87)
        .attr("y", height*0.81)
        .style("font-size", "30px")
        .text("click");
    button.on("click", function(){
      var _index = ~~(Math.random() * total);
      moveto(cityname[_index], cityordinate[cityname[_index]]);
    });
Related recommendations:
Three.js implementation of 3D map instance sharing
Introduction to the method of making tables using D3.js
D3.js drawing vector graphics + drag-and-drop implementation ideas
The above is the detailed content of Sharing examples of creating logistics maps with D3.js. For more information, please follow other related articles on the PHP Chinese website!
Related articles
See more- An in-depth analysis of the Bootstrap list group component
- Detailed explanation of JavaScript function currying
- Complete example of JS password generation and strength detection (with demo source code download)
- Angularjs integrates WeChat UI (weui)
- How to quickly switch between Traditional Chinese and Simplified Chinese with JavaScript and the trick for websites to support switching between Simplified and Traditional Chinese_javascript skills