Code debugging basics for getting started with Pycharm
This article mainly introduces the third part of the most complete Pycharm learning tutorial to code running and debugging in detail. It has certain reference value. Interested friends can refer to
Pycharm code running and debugging. , the specific content is as follows
1. Preparation
(1) The Python version is 2.7 or higher
(2) A Python project has been created and the content has been added , specific reference: Getting Started tutorial
2. Step 1 - Run the code
Open the Solver.py file written before, right-click in the edit box and select "Run" in the shortcut menu 'Solver'" option.

At this time, the script file runs normally and the output value of the program is displayed in the debugging tool window:

Next We will explain the specific contents of these two steps in detail.
3. What is Run/Debug mode
Each script file that needs to be run/debug needs a special configuration file to specify its script name and directory. and other important running debugging information. Pycharm has integrated this configuration file to avoid users having to create it manually.
Every time you click the Run or Debug button (or perform the same operation in the shortcut menu), the current run/debug configuration file is actually loaded into the current Debugging Model.
If you look carefully at the first picture, you will find that there is no run/debug related information in the combo box at all, and they only appear in the second picture. This means that the run/debug configuration file of the Solver script will be automatically generated when the run/debug command is executed, as shown now.
At this time, the two buttons Run (green arrow button) and Debug (green beetle button) become available in the main toolbar:

At the same time, this The two icons are still semi-transparent, which means they are temporary, automatically created by Pycharm.
OK, click the drop-down arrow to view the currently available command operations:

If you have set up multiple run/debug configuration schemes, they will all Displayed heredrop-down list, click to select one as the run/debug configuration file of the current project.
4. Save run/debug configuration information
In the drop-down list above, click the Edit configuration option to open the run/debug configuration editing window:
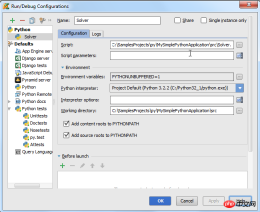
Two nodes will appear in the left directory: Python and Default. There is a single configuration option 'Solver' under the first node directory, and under the second option there are many configuration information.
What does this mean?
Under the Default node, you can only see the name of the framework or the mode name. If you create a new Run/Debug configuration file, it will branch in the selected mode Create it under the Default node. If you change the settings under the Default node, all configuration files related to it will be changed accordingly.
For example, if you want to replace the Python interpreter used in Pycharm with a remote or local interpreter, you can change the interpreter settings under the Python page so that all new debugging configuration files will use this new one. interpreter.
In the early Python node, only a single configuration option 'Solver' was used. It was a Python type configuration, but it was different from the Python mechanism under the Default node. It was represented by a non-transparent icon. , which is used to indicate the saving status of the current configuration file. When you save the configuration file, the icon will become opaque. For example, we create a new configuration file for the current Solver script under the Python type and name it 'Solver1'. If you make any changes to an existing configuration file, these changes will only be applied to the corresponding script area.
5. Official operation
We have been able to run the script in a very direct way. Next, we will look for other ways to run the script.
As we know, running a script means loading the current debugging configuration file. Therefore, running a script mainly follows the following process:
(1) In the main toolbar, click the run/debug group box to confirm the current debugging configuration file information
(2) Do the following (select one of the three):
Click the Run button to load the configuration file
Press the Shift+F10 shortcut key
On the main menu, select Run → Run
At this point, we You can observe the running results of the program in the Run tool window.
6. Run the test program
We are not discussing the importance of code testing here, but exploring how Pycharm can help us complete this function.
7. Select a tester
First, you need to specify a tester. Click the Settings button on the toolbar to open the Settings/Preferences dialog box, and then click to enter the Python Intergated Tools page (can be found through the search function). The default selection is as follows:

Here we select Nosetests, save and close the dialog box.
8. Create a test program block
First we create a test instance. Pycharm provides a very smart way to create test code: click to select the class name and press the Ctrl+Shift+T shortcut key, or select Navigate → Test in the main menu. If the test program already exists, it will jump directly Go to the corresponding code, otherwise create it:

Follow the system prompts, Pycharm will display the following dialog box:

Click the OK button to view the creation result:

function.
9. Run the test code After everything is ready, right-click the test class name and select the run command in the pop-up shortcut menu:


properties. If you want to change the properties of the breakpoint, Right-click the breakpoint:


(2) The line of code where the breakpoint is located turns blue, which means that the Pycharm program process has reached the breakpoint, but the code marked by the breakpoint has not yet been executed.
(3) The Debug tool window appears, showing the current important debugging information and allowing the user to make changes to the debugging process.

Although the Pycharm user manual has fully provided the functional information of all controls in the debugging window, we still briefly introduce them here. We find that the window is divided into two tabs: Debugger tab and the Console tab.
(1) The Debugger window is divided into three visible areas: Frames, Variables, and Watches. These windows list the current framework and running processes, allowing users to view the status of variables in the program space, etc. When you select a frame, related variable information will be displayed. Of course, these areas can be folded and hidden.
(2) The Console window displays the current console output information. By default, this window is located under the Debugger. You can click its label to display it in front.
Of course we can change the placement of these windows, if you don’t like the default layout of the program. See the Moving tabs and areas chapter for details.
The working mode of the Debugger window:
OK, now the program is suspended at the first breakpoint, and the Frames window displays the process demo corresponding to the 7th line of code in the Solver script, related Variables a, b, c have been defined, but variable d has not yet been defined. Next?
Press F9 (or the green arrow on the left toolbar), and the program will continue to run to the next breakpoint. In this way, you can run each breakpoint again and observe the changes in variables. .
For more information about the Debugger window, please refer to the software manual: product documentation
The working mode of the Console window:
Why do you need to use the Console window? When we need to view the error message given by the program, or perform some additional temporary operations, we need to do it in this window.
Click the Console tab to bring it to the front:

Then click the command button in the left toolbar to display the Python command prompt :

At this point the console mechanism is activated and try to execute some Python commands in it:

Notice the control The console window provides code spelling tips (Ctrl+Space) and historical memory (Up/Down keys) functions. For more information, see: Using Debug Console
Finally, if you want the Console window to be always available, Just move it into a separate window:

14. Run again
After completing this debugging run and loading the debugging configuration again After file, we can run debugging again by clicking the run button on the toolbar.
15. REPL - Debugging programs in the console interface
Finally, if you are more accustomed to working in a console environment, you can also set Pycharm to console mode. Select Tools → Run Python Console... in the main menu to load the console:

At this time, the console window will be activated and displayed as a separate window:

We can do a lot of interesting things in this console window. Next we demonstrate how to import the code in the recently written Solver.py file into the console:
Open the Solver.py file (there are various ways to open it, such as Ctrl+E - View → Recent Files), select all the code content in the file (Ctrl+A, or Edit → Select All), and then Press Alt+Shift+E (or right-click and select Execute Selection in Console in the pop-up shortcut menu):

At this time, Pycharm will automatically select the selected code Import it into the console interface so that we can edit it:

【Related recommendations】
3. Python object-oriented video tutorial
The above is the detailed content of Code debugging basics for getting started with Pycharm. For more information, please follow other related articles on the PHP Chinese website!
 Python vs. C : Understanding the Key DifferencesApr 21, 2025 am 12:18 AM
Python and C each have their own advantages, and the choice should be based on project requirements. 1) Python is suitable for rapid development and data processing due to its concise syntax and dynamic typing. 2)C is suitable for high performance and system programming due to its static typing and manual memory management.
 Python vs. C : Which Language to Choose for Your Project?Apr 21, 2025 am 12:17 AM
Choosing Python or C depends on project requirements: 1) If you need rapid development, data processing and prototype design, choose Python; 2) If you need high performance, low latency and close hardware control, choose C.
 Reaching Your Python Goals: The Power of 2 Hours DailyApr 20, 2025 am 12:21 AM
By investing 2 hours of Python learning every day, you can effectively improve your programming skills. 1. Learn new knowledge: read documents or watch tutorials. 2. Practice: Write code and complete exercises. 3. Review: Consolidate the content you have learned. 4. Project practice: Apply what you have learned in actual projects. Such a structured learning plan can help you systematically master Python and achieve career goals.
 Maximizing 2 Hours: Effective Python Learning StrategiesApr 20, 2025 am 12:20 AM
Methods to learn Python efficiently within two hours include: 1. Review the basic knowledge and ensure that you are familiar with Python installation and basic syntax; 2. Understand the core concepts of Python, such as variables, lists, functions, etc.; 3. Master basic and advanced usage by using examples; 4. Learn common errors and debugging techniques; 5. Apply performance optimization and best practices, such as using list comprehensions and following the PEP8 style guide.
 Choosing Between Python and C : The Right Language for YouApr 20, 2025 am 12:20 AM
Python is suitable for beginners and data science, and C is suitable for system programming and game development. 1. Python is simple and easy to use, suitable for data science and web development. 2.C provides high performance and control, suitable for game development and system programming. The choice should be based on project needs and personal interests.
 Python vs. C : A Comparative Analysis of Programming LanguagesApr 20, 2025 am 12:14 AM
Python is more suitable for data science and rapid development, while C is more suitable for high performance and system programming. 1. Python syntax is concise and easy to learn, suitable for data processing and scientific computing. 2.C has complex syntax but excellent performance and is often used in game development and system programming.
 2 Hours a Day: The Potential of Python LearningApr 20, 2025 am 12:14 AM
It is feasible to invest two hours a day to learn Python. 1. Learn new knowledge: Learn new concepts in one hour, such as lists and dictionaries. 2. Practice and exercises: Use one hour to perform programming exercises, such as writing small programs. Through reasonable planning and perseverance, you can master the core concepts of Python in a short time.
 Python vs. C : Learning Curves and Ease of UseApr 19, 2025 am 12:20 AM
Python is easier to learn and use, while C is more powerful but complex. 1. Python syntax is concise and suitable for beginners. Dynamic typing and automatic memory management make it easy to use, but may cause runtime errors. 2.C provides low-level control and advanced features, suitable for high-performance applications, but has a high learning threshold and requires manual memory and type safety management.


Hot AI Tools

Undresser.AI Undress
AI-powered app for creating realistic nude photos

AI Clothes Remover
Online AI tool for removing clothes from photos.

Undress AI Tool
Undress images for free

Clothoff.io
AI clothes remover

Video Face Swap
Swap faces in any video effortlessly with our completely free AI face swap tool!

Hot Article

Hot Tools

Atom editor mac version download
The most popular open source editor

SublimeText3 Linux new version
SublimeText3 Linux latest version

mPDF
mPDF is a PHP library that can generate PDF files from UTF-8 encoded HTML. The original author, Ian Back, wrote mPDF to output PDF files "on the fly" from his website and handle different languages. It is slower than original scripts like HTML2FPDF and produces larger files when using Unicode fonts, but supports CSS styles etc. and has a lot of enhancements. Supports almost all languages, including RTL (Arabic and Hebrew) and CJK (Chinese, Japanese and Korean). Supports nested block-level elements (such as P, DIV),

Zend Studio 13.0.1
Powerful PHP integrated development environment

SecLists
SecLists is the ultimate security tester's companion. It is a collection of various types of lists that are frequently used during security assessments, all in one place. SecLists helps make security testing more efficient and productive by conveniently providing all the lists a security tester might need. List types include usernames, passwords, URLs, fuzzing payloads, sensitive data patterns, web shells, and more. The tester can simply pull this repository onto a new test machine and he will have access to every type of list he needs.


