Home >Web Front-end >JS Tutorial >Sample code of pure JavaScript chart component dhtmlxChart
Sample code of pure JavaScript chart component dhtmlxChart
- 黄舟Original
- 2017-03-16 14:39:551628browse
PureJavaScriptSample code of chart component dhtmlxChart
dhtmlxChart is also a JavaScript-based Chart application component, similar to xCharts shared before, dhtmlxChart also provides a very rich chart type. It should be said that compared with xCharts, it provides more chart types, including pie charts, radar charts, Discrete point plots and more complex chart types. dhtmlxChart provides an open source version, but its commercial version costs more than $49, which is a bit expensive.
Configuration of dhtmlxChart
Quote the related js scripts and css files of dhtmlx on the page to complete the installation:
<link rel="stylesheet" type="text/css" href="../../../codebase/dhtmlx.css"/>
<script src="../../../codebase/dhtmlx.js"></script>
The path needs to be modified by yourself.
In addition, dhtmlxChart provides 4 data source formats, supporting XML, JSON, CSV and JSarray, taking XML as an example:
window.onload = function(){
        var barChart =  new dhtmlXChart({
            view:"bar",
            container:"chartp",
            value:"#sales#",
            gradient:"falling",
            color:"#b9a8f9",
            radius:0,
            alpha:0.5,
            border:true,
            width:70,
            xAxis:{
                template:"#year#"
            },
            yAxis:{
                start:0,
                end:100,
                step:10,
                template:function(obj){
                    return (obj%20?"":obj)
                }
            }
        })
        barChart.load("../common/data.xml");
	}
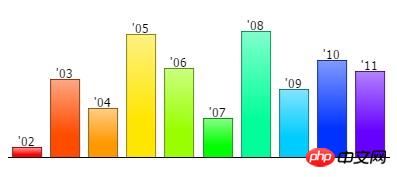
dhtmlxChart column chart generation
window.onload = function(){
	var barChart1 =  new dhtmlXChart({
		view:"bar",
		container:"chart1",
	    value:"#sales#",
        label:"'#year#",
        barWidth:35,
        radius:0,
        gradient:"rising"
	})
	barChart1.parse(dataset,"json");
	barChart1.attachEvent("onItemClick",function(id){alert(id)})
	var barChart2 =  new dhtmlXChart({
		view:"bar",
		container:"chart2",
	    value:"#sales#",
        label:"'#year#",
        color:"#66ccff",
        gradient:"rising",
        barWidth:25,
        padding:{
            top:50,
            bottom:0,
            right:50,
            left:50
        }
	});
	barChart2.parse(dataset,"json");
	}
The json data format is used here.
The rendering is as follows:

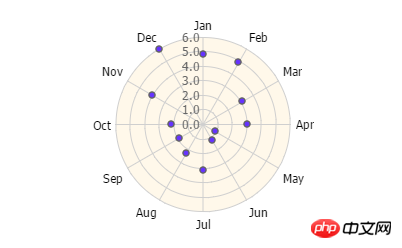
var chart =  new dhtmlXChart({
            container:"chartp",
            view:"radar",
			value:"#companyA#",
            disableLines:true,
			item:{
                borderWidth:0,
                radius:2,
				color: "#6633ff"
			},
			xAxis:{
				template:"#month#"
			},
			yAxis:{
				lineShape:"arc",
                bg:"#fff8ea",
                template:function(value){
                    return parseFloat(value).toFixed(1)
                }
			}
        });
        chart.parse(companies,"json");
The rendering is as follows:

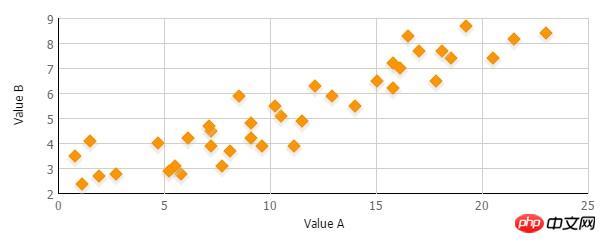
chart =  new dhtmlXChart({
            view:"scatter",
			container:"chartp",
	    	value:"#b#",
			xValue: "#a#",
            yAxis:{
                title:"Value B"
            },
            xAxis:{
                title:"Value A"
            },
            tooltip:{
              template:"#a# - #b#"
            },
            item:{
                radius:5,
                borderColor:"#f38f00",
                borderWidth:1,
                color:"#ff9600",
                type:"d",
                shadow:true
            }
        });
		chart.parse(scatter_dataset,"json");
The rendering is as follows:

The above is the detailed content of Sample code of pure JavaScript chart component dhtmlxChart. For more information, please follow other related articles on the PHP Chinese website!
Related articles
See more- An in-depth analysis of the Bootstrap list group component
- Detailed explanation of JavaScript function currying
- Complete example of JS password generation and strength detection (with demo source code download)
- Angularjs integrates WeChat UI (weui)
- How to quickly switch between Traditional Chinese and Simplified Chinese with JavaScript and the trick for websites to support switching between Simplified and Traditional Chinese_javascript skills

