


Many JavaScript engines, such as Google's V8 engine (used by Chrome and Node), are specifically designed for large JavaScript applications that require fast execution. If you are a developer and are concerned about memory usage and page performance, you should understand how the JavaScript engine in the user's browser works. Whether it's V8, SpiderMonkey (Firefox), Carakan (Opera), Chakra (IE) or another engine, doing this can help you better optimize your application. This doesn’t mean you should optimize for a specific browser or engine, don’t do that.
However, you should ask yourself a few questions:
In my code, can I make the code more efficient?
What optimizations have been done by mainstream JavaScript engines?
What can’t be optimized by the engine? Can the garbage collector (GC) recover what I expect?
There are some common pitfalls when writing high-performance code. In this article, we will show some proven, A better way to write code.
So, how does JavaScript work in V8?
If you don’t have a deep understanding of the JS engine, there is no problem in developing a large-scale web application. It’s like a person who can drive has only seen the hood but not what’s inside the car. Same engine. Since Chrome is my browser of choice, let’s talk about its JavaScript engine. V8 is composed of the following core parts:
- A basic compiler
, which parses JavaScript code and generates local machine code before the code is executed, and Rather than executing the bytecode or simply interpreting it. These codes are not highly optimized to begin with.
V8 builds objects into an - Object Model
. In JavaScript objects are represented as associative arrays, but in V8 objects are treated as hidden classes, an internal type system for optimizing queries.
- Runtime Analyzer
Monitors the running system and identifies "hot" functions (such as code that takes a long time to run).
- Optimizing compiler
Recompile and optimize the code identified as "hot" by the runtime analyzer, and perform "inlining" and other optimizations (for example, using The callee's body replaces the function call).
V8 supports de - optimization
, which means that if the optimizing compiler finds that the assumptions for code optimization are too optimistic, it will discard the optimized code.
V8 has a - garbage collector
, and understanding how it works is just as important as optimizing JavaScript.
Garbage collection is a form of
memory management, which is actually the concept of a collector. Attempts to reclaim memory occupied by objects that are no longer in use. In a garbage-collected language like JavaScript, objects that are still referenced in the application are not cleared. Manually eliminating object references is not necessary in most cases. By simply placing variables where they are needed (ideally, as locally scoped as possible, i.e. inside the function they are used in rather than outside the function), everything will work just fine.

In JavaScript, it is impossible to force garbage Recycled. You shouldn't do this because the garbage collection process is controlled by the runtime, which knows when the best time to clean up is.
Misunderstanding of "Dereference"
Many discussions on JavaScript memory recycling on the Internet talk about the delete keyword, although it can be used to delete objects ( map), but some developers believe that it can be used to force "elimination of references". It is recommended to avoid using delete as much as possible. In the following example, delete o.x does more harm than good because it changes the hidden class of o and makes it a "slow object".
var o = { x: 1 };
delete o.x; // true
o.x; // undefined
You'll easily find quote removal in popular JS libraries - it's language purposeful. What needs to be noted here is to avoid modifying the structure of "hot" objects at runtime. The JavaScript engine can detect such "hot" objects and try to optimize them. If the object's structure does not change significantly during its life cycle, it will be easier for the engine to optimize the object, and the delete operation will actually trigger such large structural changes, which is not conducive to engine optimization.
There are also misunderstandings about how null works. Setting an object reference to null does not make the object "null", it just sets its reference to null. Using o.x=null is better than using delete, but it may not be necessary.
var o = { x: 1 };
o = null;
o; // null
o.x // TypeError
如果此引用是当前对象的最后引用,那么该对象将被作为垃圾回收。如果此引用不是当前对象的最后引用,则该对象是可访问的且不会被垃圾回收。
另外需要注意的是,全局变量在页面的生命周期里是不被垃圾回收器清理的。无论页面打开多久,JavaScript运行时全局对象作用域中的变量会一直存在。
var myGlobalNamespace = {};全局对象只会在刷新页面、导航到其他页面、关闭标签页或退出浏览器时才会被清理。函数作用域的变量将在超出作用域时被清理,即退出函数时,已经没有任何引用,这样的变量就被清理了。
经验法则
为了使垃圾回收器尽早收集尽可能多的对象,不要hold着不再使用的对象。这里有几件事需要记住:
正如前面提到的,在合适的范围内使用变量是手动消除引用的更好选择。即一个变量只在一个函数作用域中使用,就不要在全局作用域声明它。这意味着更干净省心的代码。
确保解绑那些不再需要的事件监听器,尤其是那些即将被销毁的DOM对象所绑定的事件监听器。
如果使用的数据缓存在本地,确保清理一下缓存或使用老化机制,以避免大量不被重用的数据被存储。
函数
接下来,我们谈谈函数。正如我们已经说过,垃圾收集的工作原理,是通过回收不再是访问的内存块(对象)。为了更好地说明这一点,这里有一些例子。
function foo() {
    var bar = new LargeObject();
    bar.someCall();
}
当foo返回时,bar指向的对象将会被垃圾收集器自动回收,因为它已没有任何存在的引用了。
对比一下:
function foo() {
    var bar = new LargeObject();
    bar.someCall();
    return bar;
}
// somewhere else
var b = foo();
现在我们有一个引用指向bar对象,这样bar对象的生存周期就从foo的调用一直持续到调用者指定别的变量b(或b超出范围)。
闭包(CLOSURES)
当你看到一个函数,返回一个内部函数,该内部函数将获得范围外的访问权,即使在外部函数执行之后。这是一个基本的闭包 —— 可以在特定的上下文中设置的变量的表达式。例如:
function sum (x) {
    function sumIt(y) {
        return x + y;
    };
    return sumIt;
}
// Usage
var sumA = sum(4);
var sumB = sumA(3);
console.log(sumB); // Returns 7
在sum调用上下文中生成的函数对象(sumIt)是无法被回收的,它被全局变量(sumA)所引用,并且可以通过sumA(n)调用。
让我们来看看另外一个例子,这里我们可以访问变量largeStr吗?
var a = function () {
    var largeStr = new Array(1000000).join('x');
    return function () {
        return largeStr;
    };
}();
是的,我们可以通过a()访问largeStr,所以它没有被回收。下面这个呢?
var a = function () {
    var smallStr = 'x';
    var largeStr = new Array(1000000).join('x');
    return function (n) {
        return smallStr;
    };
}();
我们不能再访问largeStr了,它已经是垃圾回收候选人了。【译者注:因为largeStr已不存在外部引用了】
定时器
最糟的内存泄漏地方之一是在循环中,或者在setTimeout()/ setInterval()中,但这是相当常见的。思考下面的例子:
var myObj = {
    callMeMaybe: function () {
        var myRef = this;
        var val = setTimeout(function () {
            console.log('Time is running out!');
            myRef.callMeMaybe();
        }, 1000);
    }
};
如果我们运行myObj.callMeMaybe();来启动定时器,可以看到控制台每秒打印出“Time is running out!”。如果接着运行myObj = null,定时器依旧处于激活状态。为了能够持续执行,闭包将myObj传递给setTimeout,这样myObj是无法被回收的。相反,它引用到myObj的因为它捕获了myRef。这跟我们为了保持引用将闭包传给其他的函数是一样的。
同样值得牢记的是,setTimeout/setInterval调用(如函数)中的引用,将需要执行和完成,才可以被垃圾收集。
当心性能陷阱
永远不要优化代码,直到你真正需要。现在经常可以看到一些基准测试,显示N比M在V8中更为优化,但是在模块代码或应用中测试一下会发现,这些优化真正的效果比你期望的要小的多。

做的过多还不如什么都不做. 图片来源: Tim Sheerman-Chase.
比如我们想要创建这样一个模块:
需要一个本地的数据源包含数字ID
绘制包含这些数据的表格
添加事件处理程序,当用户点击的任何单元格时切换单元格的css class
这个问题有几个不同的因素,虽然也很容易解决。我们如何存储数据,如何高效地绘制表格并且append到DOM中,如何更优地处理表格事件?
面对这些问题最开始(天真)的做法是使用对象存储数据并放入数组中,使用jQuery遍历数据绘制表格并append到DOM中,最后使用事件绑定我们期望地点击行为。
注意:这不是你应该做的
var moduleA = function () {
return {
data: dataArrayObject,
init: function () {
this.addTable();
this.addEvents();
},
addTable: function () {
for (var i = 0; i < rows; i++) {
$tr = $('<tr></tr>');
for (var j = 0; j < this.data.length; j++) {
$tr.append('<td>' + this.data[j]['id'] + '</td>');
}
$tr.appendTo($tbody);
}
},
addEvents: function () {
$('table td').on('click', function () {
$(this).toggleClass('active');
});
}
};
}();这段代码简单有效地完成了任务。
但在这种情况下,我们遍历的数据只是本应该简单地存放在数组中的数字型属性ID。有趣的是,直接使用DocumentFragment和本地DOM方法比使用jQuery(以这种方式)来生成表格是更优的选择,当然,事件代理比单独绑定每个td具有更高的性能。
要注意虽然jQuery在内部使用DocumentFragment,但是在我们的例子中,代码在循环内调用append并且这些调用涉及到一些其他的小知识,因此在这里起到的优化作用不大。希望这不会是一个痛点,但请务必进行基准测试,以确保自己代码ok。
对于我们的例子,上述的做法带来了(期望的)性能提升。事件代理对简单的绑定是一种改进,可选的DocumentFragment也起到了助推作用。
var moduleD = function () {
return {
data: dataArray,
init: function () {
this.addTable();
this.addEvents();
},
addTable: function () {
var td, tr;
var frag = document.createDocumentFragment();
var frag2 = document.createDocumentFragment();
for (var i = 0; i < rows; i++) {
tr = document.createElement('tr');
for (var j = 0; j < this.data.length; j++) {
td = document.createElement('td');
td.appendChild(document.createTextNode(this.data[j]));
frag2.appendChild(td);
}
tr.appendChild(frag2);
frag.appendChild(tr);
}
tbody.appendChild(frag);
},
addEvents: function () {
$('table').on('click', 'td', function () {
$(this).toggleClass('active');
});
}
};
}();接下来看看其他提升性能的方式。你也许曾经在哪读到过使用原型模式比模块模式更优,或听说过使用JS模版框架性能更好。有时的确如此,不过使用它们其实是为了代码更具可读性。对了,还有预编译!让我们看看在实践中表现的如何?
moduleG = function () {};
moduleG.prototype.data = dataArray;
moduleG.prototype.init = function () {
    this.addTable();
    this.addEvents();
};
moduleG.prototype.addTable = function () {
    var template = _.template($('#template').text());
    var html = template({'data' : this.data});
    $tbody.append(html);
};
moduleG.prototype.addEvents = function () {
   $('table').on('click', 'td', function () {
       $(this).toggleClass('active');
   });
};
var modG = new moduleG();
事实证明,在这种情况下的带来的性能提升可以忽略不计。模板和原型的选择并没有真正提供更多的东西。也就是说,性能并不是开发者使用它们的原因,给代码带来的可读性、继承模型和可维护性才是真正的原因。
更复杂的问题包括高效地在canvas上绘制图片和操作带或不带类型数组的像素数据。
在将一些方法用在你自己的应用之前,一定要多了解这些方案的基准测试。也许有人还记得JS模版的shoot-off和随后的扩展版。你要搞清楚基准测试不是存在于你看不到的那些虚拟应用,而是应该在你的实际代码中去测试带来的优化。
V8优化技巧
详细介绍了每个V8引擎的优化点在本文讨论范围之外,当然这里也有许多值得一提的技巧。记住这些技巧你就能减少那些性能低下的代码了。
特定模式可以使V8摆脱优化的困境,比如说try-catch。欲了解更多有关哪些函数能或不能进行优化,你可以在V8的脚本工具d8中使用–trace-opt file.js命令。
如果你关心速度,尽量使你的函数职责单一,即确保变量(包括属性,数组,函数参数)只使用相同隐藏类包含的对象。举个例子,别这么干:
function add(x, y) {
   return x+y;
}
add(1, 2);
add('a','b');
add(my_custom_object, undefined);
不要加载未初始化或已删除的元素。如果这么做也不会出现什么错误,但是这样会使速度变慢。
不要使函数体过大,这样会使得优化更加困难。
更多内容可以去看Daniel Clifford在Google I/O的分享 Breaking the JavaScript Speed Limit with V8。 Optimizing For V8 — A Series也非常值得一读。
对象VS数组:我应该用哪个?
如果你想存储一串数字,或者一些相同类型的对象,使用一个数组。
如果你语义上需要的是一堆的对象的属性(不同类型的),使用一个对象和属性。这在内存方面非常高效,速度也相当快。
整数索引的元素,无论存储在一个数组或对象中,都要比遍历对象的属性快得多。
对象的属性比较复杂:它们可以被setter们创建,具有不同的枚举性和可写性。数组中则不具有如此的定制性,而只存在有和无这两种状态。在引擎层面,这允许更多存储结构方面的优化。特别是当数组中存在数字时,例如当你需要容器时,不用定义具有x,y,z属性的类,而只用数组就可以了。
JavaScript中对象和数组之间只有一个的主要区别,那就是数组神奇的length属性。如果你自己来维护这个属性,那么V8中对象和数组的速度是一样快的。
使用对象时的技巧
使用一个构造函数来创建对象。这将确保它创建的所有对象具有相同的隐藏类,并有助于避免更改这些类。作为一个额外的好处,它也略快于Object.create()
你的应用中,对于使用不同类型的对象和其复杂度(在合理的范围内:长原型链往往是有害的,呈现只有一个极少数属性的对象比大对象会快一点)是有没限制的。对于“hot”对象,尽量保持短原型链,并且少属性。
对象克隆
对于应用程序开发人员,对象克隆是一个常见的问题。虽然各种基准测试可以证明V8对这个问题处理得很好,但仍要小心。复制大的东西通常是较慢的——不要这么做。JS中的for..in循环尤其糟糕,因为它有着恶魔般的规范,并且无论是在哪个引擎中,都可能永远不会比任何对象快。
当你一定要在关键性能代码路径上复制对象时,使用数组或一个自定义的“拷贝构造函数”功能明确地复制每个属性。这可能是最快的方式:
function clone(original) {
  this.foo = original.foo;
  this.bar = original.bar;
}
var copy = new clone(original);
模块模式中缓存函数
使用模块模式时缓存函数,可能会导致性能方面的提升。参阅下面的例子,因为它总是创建成员函数的新副本,你看到的变化可能会比较慢。
另外请注意,使用这种方法明显更优,不仅仅是依靠原型模式(经过jsPerf测试确认)。

使用模块模式或原型模式时的性能提升
这是一个原型模式与模块模式的性能对比测试:
  // Prototypal pattern
  Klass1 = function () {}
  Klass1.prototype.foo = function () {
      log('foo');
  }
  Klass1.prototype.bar = function () {
      log('bar');
  }
  // Module pattern
  Klass2 = function () {
      var foo = function () {
          log('foo');
      },
      bar = function () {
          log('bar');
      };
      return {
          foo: foo,
          bar: bar
      }
  }
  // Module pattern with cached functions
  var FooFunction = function () {
      log('foo');
  };
  var BarFunction = function () {
      log('bar');
  };
  Klass3 = function () {
      return {
          foo: FooFunction,
          bar: BarFunction
      }
  }
  // Iteration tests
  // Prototypal
  var i = 1000,
      objs = [];
  while (i--) {
      var o = new Klass1()
      objs.push(new Klass1());
      o.bar;
      o.foo;
  }
  // Module pattern
  var i = 1000,
      objs = [];
  while (i--) {
      var o = Klass2()
      objs.push(Klass2());
      o.bar;
      o.foo;
  }
  // Module pattern with cached functions
  var i = 1000,
      objs = [];
  while (i--) {
      var o = Klass3()
      objs.push(Klass3());
      o.bar;
      o.foo;
  }
// See the test for full details
使用数组时的技巧
接下来说说数组相关的技巧。在一般情况下,不要删除数组元素,这样将使数组过渡到较慢的内部表示。当索引变得稀疏,V8将会使元素转为更慢的字典模式。
数组字面量
数组字面量非常有用,它可以暗示VM数组的大小和类型。它通常用在体积不大的数组中。
// Here V8 can see that you want a 4-element array containing numbers:
var a = [1, 2, 3, 4];
// Don't do this:
a = []; // Here V8 knows nothing about the array
for(var i = 1; i <= 4; i++) {
     a.push(i);
}
存储单一类型VS多类型
将混合类型(比如数字、字符串、undefined、true/false)的数据存在数组中绝不是一个好想法。例如var arr = [1, “1”, undefined, true, “true”]
类型推断的性能测试
正如我们所看到的结果,整数的数组是最快的。
稀疏数组与满数组
当你使用稀疏数组时,要注意访问元素将远远慢于满数组。因为V8不会分配一整块空间给只用到部分空间的数组。取而代之的是,它被管理在字典中,既节约了空间,但花费访问的时间。
稀疏数组与满数组的测试
预分配空间VS动态分配
不要预分配大数组(如大于64K的元素),其最大的大小,而应该动态分配。在我们这篇文章的性能测试之前,请记住这只适用部分JavaScript引擎。

空字面量与预分配数组在不同的浏览器进行测试
Nitro (Safari)对预分配的数组更有利。而在其他引擎(V8,SpiderMonkey)中,预先分配并不是高效的。
预分配数组测试
// Empty array
var arr = [];
for (var i = 0; i < 1000000; i++) {
    arr[i] = i;
}
// Pre-allocated array
var arr = new Array(1000000);
for (var i = 0; i < 1000000; i++) {
    arr[i] = i;
}
优化你的应用
在Web应用的世界中,速度就是一切。没有用户希望用一个要花几秒钟计算某列总数或花几分钟汇总信息的表格应用。这是为什么你要在代码中压榨每一点性能的重要原因。

图片来源: Per Olof Forsberg.
理解和提高应用程序的性能是非常有用的同时,它也是困难的。我们推荐以下的步骤来解决性能的痛点:
测量:在您的应用程序中找到慢的地方(约45%)
理解:找出实际的问题是什么(约45%)
修复它! (约10%)
下面推荐的一些工具和技术可以协助你。
基准化(BENCHMARKING)
有很多方式来运行JavaScript代码片段的基准测试其性能——一般的假设是,基准简单地比较两个时间戳。这中模式被jsPerf团队指出,并在SunSpider和Kraken的基准套件中使用:
var totalTime,
    start = new Date,
    iterations = 1000;
while (iterations--) {
  // Code snippet goes here
}
// totalTime → the number of milliseconds taken
// to execute the code snippet 1000 times
totalTime = new Date - start;
在这里,要测试的代码被放置在一个循环中,并运行一个设定的次数(例如6次)。在此之后,开始日期减去结束日期,就得出在循环中执行操作所花费的时间。
然而,这种基准测试做的事情过于简单了,特别是如果你想运行在多个浏览器和环境的基准。垃圾收集器本身对结果是有一定影响的。即使你使用window.performance这样的解决方案,也必须考虑到这些缺陷。
Whether you just run the benchmark portion of the code, write a test suite or code a benchmark library, there is more to JavaScript benchmarks than you think. For a more detailed guide to benchmarking, I highly recommend reading Javascript Benchmarks by Mathias Bynens and John-David Dalton.
ANALYSIS (PROFILING)
Chrome developer tools have good support for JavaScript analysis. You can use this feature to detect which functions take up the most time so you can optimize them. This is important because even small changes to your code can have a significant impact on overall performance.

Chrome Developer Tools Analysis Panel
The analysis process begins by obtaining the code performance baseline, which is then reflected in the form of a timeline. This will tell us how long the code takes to run. The "Profiles" tab gives us a better view of what's going on in the application. The JavaScript CPU profile shows how much CPU time is being used by our code, the CSS selector profile shows how much time is spent processing selectors, and the heap snapshot shows how much memory is being used for our objects.
Using these tools, we can isolate, tune, and reanalyze to measure whether our functional or operational performance optimizations are actually having an impact.

The "Profile" tab displays code performance information.
For a good introduction to profiling, read JavaScript Profiling With The Chrome Developer Tools by Zack Grossbart.
Tip: Ideally, if you want to ensure that your analysis is not affected by installed applications or extensions, you can start Chrome with the --user-data-dir
Avoiding memory leaks - 3 snapshot technology
Within Google, Chrome developer tools are heavily used by teams such as Gmail to help discover and eliminate memory leaks.

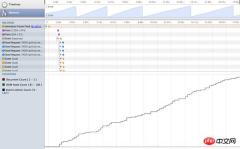
Memory statistics in Chrome developer tools
Memory statistics show the private memory usage and JavaScript heap that our team is concerned about. Size, number of DOM nodes, storage cleanup, event listener counters and things being collected by the garbage collector. Recommended reading is Loreena Lee’s “3 Snapshot” technique. The gist of this technique is to log some behavior in your application, force a garbage collection, check that the number of DOM nodes has returned to the expected baseline, and then analyze three heap snapshots to determine if there are any memory leaks.
Memory management of single-page applications
Memory management of single-page applications (such as AngularJS, Backbone, Ember) is very important, they will almost never refresh page. This means that memory leaks can be quite obvious. Single-page applications on mobile terminals are fraught with pitfalls because the device has limited memory and long-running applications such as email clients or social networks. The greater the ability, the greater the responsibility.
There are many ways to solve this problem. In Backbone, make sure to use dispose() to dispose of old views and references (currently available in Backbone (Edge)). This function was recently added and removes handlers added to the view's "event" object, as well as event listeners for the model or collection passed to the view's third argument (the callback context). dispose() is also called by the view's remove() and handles the main cleanup work when the element is removed. Other libraries such as Ember will clean up listeners when they detect that an element has been removed to avoid memory leaks.
Some sage advice from Derick Bailey: Instead of understanding how events and references work, follow the standard rules for managing memory in JavaScript. If you want to load data into a Backbone collection full of user objects, and you want to clear the collection so that it no longer takes up memory, you must have all references to the collection and references to the objects in the collection. Once the reference used is clear, the resource is reclaimed. This is the standard JavaScript garbage collection rule.
Felix Geisendörfer’s tutorial on debugging memory leaks in Node is also worth reading, especially if it forms part of a wider SPA stack.In the article, Derick covers many common memory pitfalls when using Backbone.js and how to solve them.
Reduce reflow (REFLOWS)
When the browser re-renders elements in the document it needs to recalculate their position and geometry, we call it reflow. Reflows can block user activity in the browser, so it's helpful to understand how to improve reflow times.
回流时间图表
你应该批量地触发回流或重绘,但是要节制地使用这些方法。尽量不处理DOM也很重要。可以使用DocumentFragment,一个轻量级的文档对象。你可以把它作为一种方法来提取文档树的一部分,或创建一个新的文档“片段”。与其不断地添加DOM节点,不如使用文档片段后只执行一次DOM插入操作,以避免过多的回流。
例如,我们写一个函数给一个元素添加20个p。如果只是简单地每次append一个p到元素中,这会触发20次回流。
function addps(element) {
var p;
for (var i = 0; i < 20; i ++) {
p = document.createElement('p');
p.innerHTML = 'Heya!';
element.appendChild(p);
}
}要解决这个问题,可以使用DocumentFragment来代替,我们可以每次添加一个新的p到里面。完成后将DocumentFragment添加到DOM中只会触发一次回流。
function addps(element) {
var p;
// Creates a new empty DocumentFragment.
var fragment = document.createDocumentFragment();
for (var i = 0; i < 20; i ++) {
p = document.createElement('a');
p.innerHTML = 'Heya!';
fragment.appendChild(p);
}
element.appendChild(fragment);
}可以参阅 Make the Web Faster,JavaScript Memory Optimization 和 Finding Memory Leaks。
JS内存泄漏探测器
为了帮助发现JavaScript内存泄漏,谷歌的开发人员((Marja Hölttä和Jochen Eisinger)开发了一种工具,它与Chrome开发人员工具结合使用,检索堆的快照并检测出是什么对象导致了内存泄漏。

一个JavaScript内存泄漏检测工具
有完整的文章介绍了如何使用这个工具,建议你自己到内存泄漏探测器项目页面看看。
如果你想知道为什么这样的工具还没集成到我们的开发工具,其原因有二。它最初是在Closure库中帮助我们捕捉一些特定的内存场景,它更适合作为一个外部工具。
V8优化调试和垃圾回收的标志位
Chrome支持直接通过传递一些标志给V8,以获得更详细的引擎优化输出结果。例如,这样可以追踪V8的优化:
"/Applications/Google Chrome/Google Chrome" --js-flags="--trace-opt --trace-deopt"
Windows用户可以这样运行 chrome.exe –js-flags=”–trace-opt –trace-deopt”
在开发应用程序时,下面的V8标志都可以使用。
trace-opt —— 记录优化函数的名称,并显示跳过的代码,因为优化器不知道如何优化。
trace-deopt —— 记录运行时将要“去优化”的代码。
trace-gc —— 记录每次的垃圾回收。
V8的处理脚本用*(星号)标识优化过的函数,用~(波浪号)表示未优化的函数。
如果你有兴趣了解更多关于V8的标志和V8的内部是如何工作的,强烈建议 阅读Vyacheslav Egorov的excellent post on V8 internals。
HIGH-RESOLUTION TIME 和 NAVIGATION TIMING API
高精度时间(HRT)是一个提供不受系统时间和用户调整影响的亚毫秒级高精度时间接口,可以把它当做是比 new Date 和 Date.now()更精准的度量方法。这对我们编写基准测试帮助很大。

高精度时间(HRT)提供了当前亚毫秒级的时间精度
目前HRT在Chrome(稳定版)中是以window.performance.webkitNow()方式使用,但在Chrome Canary中前缀被丢弃了,这使得它可以通过window.performance.now()方式调用。Paul Irish在HTML5Rocks上了关于HRT更多内容的文章。
现在我们知道当前的精准时间,那有可以准确测量页面性能的API吗?好吧,现在有个Navigation Timing API可以使用,这个API提供了一种简单的方式,来获取网页在加载呈现给用户时,精确和详细的时间测量记录。可以在console中使用window.performance.timing来获取时间信息:

显示在控制台中的时间信息
我们可以从上面的数据获取很多有用的信息,例如网络延时为responseEnd – fetchStart,页面加载时间为loadEventEnd – responseEnd,处理导航和页面加载的时间为loadEventEnd – navigationStart。
正如你所看到的,perfomance.memory的属性也能显示JavaScript的内存数据使用情况,如总的堆大小。
更多Navigation Timing API的细节,阅读 Sam Dutton的 Measuring Page Load Speed With Navigation Timing。
ABOUT:MEMORY and ABOUT:TRACING
About:tracing in Chrome provides a performance view of the browser, recording all threads, tab pages and processes of Chrome.

About:Tracing provides a performance view of the browser
The real use of this tool is to allow you to capture Chrome's running data , so you can adjust JavaScript execution appropriately, or optimize resource loading.
Lilli Thompson has an article written for game developers using about:tracing to analyze WebGL games. It is also suitable for JavaScript developers.
You can enter about:memory in Chrome's navigation bar, which is also very practical. You can get the memory usage of each tab page, which is very helpful for locating memory leaks.
Summary
We see that there are many hidden traps in the world of JavaScript, and there is no silver bullet to improve performance. Only by comprehensively applying some optimization solutions to the (real world) test environment can the maximum performance gains be achieved. Even so, understanding how the engine interprets and optimizes code can help you tune your application.
Measure, understand, fix. Keep repeating this process.
 ##
##
Remember to pay attention to optimization, but you can abandon some small optimizations for convenience. For example, some developers choose .forEach and Object.keys instead of for and for..in loops, which are slower but more convenient to use. Make sure you have a clear head and know what optimizations are needed and what optimizations are not.
Also note that although JavaScript engines are getting faster and faster, the next real bottleneck is the DOM. The reduction of reflows and redraws is also important, so don't touch the DOM until necessary. Another thing to pay attention to is the network. HTTP requests are precious, especially on mobile terminals, so HTTP caching should be used to reduce resource loading.
Remembering these points will ensure that you get most of the information in this article. I hope it will be helpful to you!
English link: Writing Fast, Memory-Efficient JavaScript
The above is the content of writing high-performance JavaScript. For more related content, please pay attention to the PHP Chinese website (www.php.cn)!

 From Websites to Apps: The Diverse Applications of JavaScriptApr 22, 2025 am 12:02 AM
JavaScript is widely used in websites, mobile applications, desktop applications and server-side programming. 1) In website development, JavaScript operates DOM together with HTML and CSS to achieve dynamic effects and supports frameworks such as jQuery and React. 2) Through ReactNative and Ionic, JavaScript is used to develop cross-platform mobile applications. 3) The Electron framework enables JavaScript to build desktop applications. 4) Node.js allows JavaScript to run on the server side and supports high concurrent requests.
 Python vs. JavaScript: Use Cases and Applications ComparedApr 21, 2025 am 12:01 AM
Python is more suitable for data science and automation, while JavaScript is more suitable for front-end and full-stack development. 1. Python performs well in data science and machine learning, using libraries such as NumPy and Pandas for data processing and modeling. 2. Python is concise and efficient in automation and scripting. 3. JavaScript is indispensable in front-end development and is used to build dynamic web pages and single-page applications. 4. JavaScript plays a role in back-end development through Node.js and supports full-stack development.
 The Role of C/C in JavaScript Interpreters and CompilersApr 20, 2025 am 12:01 AM
C and C play a vital role in the JavaScript engine, mainly used to implement interpreters and JIT compilers. 1) C is used to parse JavaScript source code and generate an abstract syntax tree. 2) C is responsible for generating and executing bytecode. 3) C implements the JIT compiler, optimizes and compiles hot-spot code at runtime, and significantly improves the execution efficiency of JavaScript.
 JavaScript in Action: Real-World Examples and ProjectsApr 19, 2025 am 12:13 AM
JavaScript's application in the real world includes front-end and back-end development. 1) Display front-end applications by building a TODO list application, involving DOM operations and event processing. 2) Build RESTfulAPI through Node.js and Express to demonstrate back-end applications.
 JavaScript and the Web: Core Functionality and Use CasesApr 18, 2025 am 12:19 AM
The main uses of JavaScript in web development include client interaction, form verification and asynchronous communication. 1) Dynamic content update and user interaction through DOM operations; 2) Client verification is carried out before the user submits data to improve the user experience; 3) Refreshless communication with the server is achieved through AJAX technology.
 Understanding the JavaScript Engine: Implementation DetailsApr 17, 2025 am 12:05 AM
Understanding how JavaScript engine works internally is important to developers because it helps write more efficient code and understand performance bottlenecks and optimization strategies. 1) The engine's workflow includes three stages: parsing, compiling and execution; 2) During the execution process, the engine will perform dynamic optimization, such as inline cache and hidden classes; 3) Best practices include avoiding global variables, optimizing loops, using const and lets, and avoiding excessive use of closures.
 Python vs. JavaScript: The Learning Curve and Ease of UseApr 16, 2025 am 12:12 AM
Python is more suitable for beginners, with a smooth learning curve and concise syntax; JavaScript is suitable for front-end development, with a steep learning curve and flexible syntax. 1. Python syntax is intuitive and suitable for data science and back-end development. 2. JavaScript is flexible and widely used in front-end and server-side programming.
 Python vs. JavaScript: Community, Libraries, and ResourcesApr 15, 2025 am 12:16 AM
Python and JavaScript have their own advantages and disadvantages in terms of community, libraries and resources. 1) The Python community is friendly and suitable for beginners, but the front-end development resources are not as rich as JavaScript. 2) Python is powerful in data science and machine learning libraries, while JavaScript is better in front-end development libraries and frameworks. 3) Both have rich learning resources, but Python is suitable for starting with official documents, while JavaScript is better with MDNWebDocs. The choice should be based on project needs and personal interests.


Hot AI Tools

Undresser.AI Undress
AI-powered app for creating realistic nude photos

AI Clothes Remover
Online AI tool for removing clothes from photos.

Undress AI Tool
Undress images for free

Clothoff.io
AI clothes remover

Video Face Swap
Swap faces in any video effortlessly with our completely free AI face swap tool!

Hot Article
Hot Tools

MantisBT
Mantis is an easy-to-deploy web-based defect tracking tool designed to aid in product defect tracking. It requires PHP, MySQL and a web server. Check out our demo and hosting services.

Dreamweaver Mac version
Visual web development tools

SublimeText3 Mac version
God-level code editing software (SublimeText3)

PhpStorm Mac version
The latest (2018.2.1) professional PHP integrated development tool

WebStorm Mac version
Useful JavaScript development tools

