Debugging is an important part of the software development cycle. It’s challenging, confusing and vexing at the same time. In general, for slightly larger programs, debugging is inevitable. In recent years, the development of debugging tools has made many debugging tasks easier and more time-saving.
1 Hover the mouse to see the expression value

Debugging can be challenging. For example, you can see where the error occurred by running step by step within the function, and you can know who called the function by viewing the stack information, etc.
But in any case, it is very troublesome to view the values of expressions and local variables (put the expressions and local variables in the watch window).
A simpler method is to stop the mouse on the data you want to view. If it is a class or structure, you can click to expand it to quickly and easily view its fields.
2 Change variable values during operation

# The debugger is not only a tool to analyze program crashes and strange behaviors, but also can inspect data through step-by-step debugging Many bugs are solved by solving the problem of whether the behavior is as expected by the program. Sometimes, you wonder if you could set certain conditions to be true so that your program would run correctly. In fact, you just move the mouse over the variable, double-click the value, and enter the value you need. This way there is no need to modify the code or restart the program.
3 Set the next running position

A typical debugging case is that we often use the step-by-step debugging method to analyze why the function went wrong. At this time, you encounter an error returned by this function calling other functions, and this error is not what you want. What should you do? Restart debugger? Here is a better way, just drag the yellow running position arrow to the running position you want. In fact, it means skipping the intermediate running code and going directly to the desired location. It's very simple.
4 Edit and continue running

When running a very complex program and plug-in, an error is found, but you don’t want to waste time recompiling and restarting program.
It’s very simple, just modify the bug at this location and continue debugging. Visual studio will modify the program so that you can continue debugging without restarting the program.
It is worth noting that the "Edit and Continue" function has several limitations. One, it doesn't work on 64-bit code. If you want to use this feature, go to the compilation options in the project settings and select "x86" as the target platform. Don't worry, the release configuration of this target platform is separate from "debug", which means it is still the setting of "Any CPU". Second, the "Edit and continue running" function only applies to changes within a function. If you want To change the declaration of this function or add a new method, you can only choose to restart the program or continue without making any changes. If the modified method contains a lambda expression, it means that the delegate type automatically generated by the compiler has been modified, so Will cause the compiler to stop running.
5 A convenient viewing window

In the debugging window, you can not only view ordinary variable values, you can even enter $handles to track the number of open handles, and $err to view the error code of the function (then use Tools->Error to view the description of the error code) or Type @eax (@rax on 64-bit) to view the register value containing the function return value
6 Comment disassembly
 Use the internal disassembly. The assembly function makes it easier to optimize local code. Visual studio can display assembly instructions under each line of your code, and can debug assembly code step by step, and set breakpoints at any location similar to c++ ##.

Debugging multi-threaded code is painful. Might be interesting too. It depends on your debugger. A great feature of Visual studio is to view the stack information of threads in the thread window. You can easily see all threads and their stack information directly.
8 Conditional Breakpoint

If you want to reproduce a small probability event, but the breakpoint will trigger under a large number of unnecessary conditions. You can easily set conditional breakpoints. Set the breakpoint condition in the breakpoint window, and Visual studio will automatically ignore breakpoints that do not meet the conditions.
9 Memory Window

Some bugs are caused by incorrect structure definitions, lack of alignment attributes, etc. Viewing the contents of each line of memory makes it easy to locate and resolve these bugs. Visual studio's memory window can translate data into 8/16/32/64-bit numbers or floating point numbers. You can change the value directly in the editing window.
10 Jump to definition
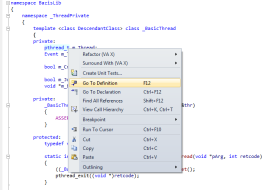
#If you are solving a bug in the code written by others, you will encounter "What is this type?" "What does this function do?" "What" and other issues, you can use visual studio's jump to definition command to view the definition of the type or function.
11 Command Window

This little trick was suggested by chaau and it can save you a lot of time. Visual studio supports a command window, which you can open through the menu View->Other Windows->Command Window. You can enter different commands in the window to automate debugging. For example, you can test MFC's COleDateTime variable with a very simple command.
The above are 11 Visual Studio debugging skills shared with you. I hope it will be helpful to your learning.
For more articles related to the summary of Visual Studio debugging skills, please pay attention to the PHP Chinese website!
 Developing with C# .NET: A Practical Guide and ExamplesMay 12, 2025 am 12:16 AM
C# and .NET provide powerful features and an efficient development environment. 1) C# is a modern, object-oriented programming language that combines the power of C and the simplicity of Java. 2) The .NET framework is a platform for building and running applications, supporting multiple programming languages. 3) Classes and objects in C# are the core of object-oriented programming. Classes define data and behaviors, and objects are instances of classes. 4) The garbage collection mechanism of .NET automatically manages memory to simplify the work of developers. 5) C# and .NET provide powerful file operation functions, supporting synchronous and asynchronous programming. 6) Common errors can be solved through debugger, logging and exception handling. 7) Performance optimization and best practices include using StringBuild
 C# .NET: Understanding the Microsoft .NET FrameworkMay 11, 2025 am 12:17 AM
.NETFramework is a cross-language, cross-platform development platform that provides a consistent programming model and a powerful runtime environment. 1) It consists of CLR and FCL, which manages memory and threads, and FCL provides pre-built functions. 2) Examples of usage include reading files and LINQ queries. 3) Common errors involve unhandled exceptions and memory leaks, and need to be resolved using debugging tools. 4) Performance optimization can be achieved through asynchronous programming and caching, and maintaining code readability and maintainability is the key.
 The Longevity of C# .NET: Reasons for its Enduring PopularityMay 10, 2025 am 12:12 AM
Reasons for C#.NET to remain lasting attractive include its excellent performance, rich ecosystem, strong community support and cross-platform development capabilities. 1) Excellent performance and is suitable for enterprise-level application and game development; 2) The .NET framework provides a wide range of class libraries and tools to support a variety of development fields; 3) It has an active developer community and rich learning resources; 4) .NETCore realizes cross-platform development and expands application scenarios.
 Mastering C# .NET Design Patterns: From Singleton to Dependency InjectionMay 09, 2025 am 12:15 AM
Design patterns in C#.NET include Singleton patterns and dependency injection. 1.Singleton mode ensures that there is only one instance of the class, which is suitable for scenarios where global access points are required, but attention should be paid to thread safety and abuse issues. 2. Dependency injection improves code flexibility and testability by injecting dependencies. It is often used for constructor injection, but it is necessary to avoid excessive use to increase complexity.
 C# .NET in the Modern World: Applications and IndustriesMay 08, 2025 am 12:08 AM
C#.NET is widely used in the modern world in the fields of game development, financial services, the Internet of Things and cloud computing. 1) In game development, use C# to program through the Unity engine. 2) In the field of financial services, C#.NET is used to develop high-performance trading systems and data analysis tools. 3) In terms of IoT and cloud computing, C#.NET provides support through Azure services to develop device control logic and data processing.
 C# .NET Framework vs. .NET Core/5/6: What's the Difference?May 07, 2025 am 12:06 AM
.NETFrameworkisWindows-centric,while.NETCore/5/6supportscross-platformdevelopment.1).NETFramework,since2002,isidealforWindowsapplicationsbutlimitedincross-platformcapabilities.2).NETCore,from2016,anditsevolutions(.NET5/6)offerbetterperformance,cross-
 The Community of C# .NET Developers: Resources and SupportMay 06, 2025 am 12:11 AM
The C#.NET developer community provides rich resources and support, including: 1. Microsoft's official documents, 2. Community forums such as StackOverflow and Reddit, and 3. Open source projects on GitHub. These resources help developers improve their programming skills from basic learning to advanced applications.
 The C# .NET Advantage: Features, Benefits, and Use CasesMay 05, 2025 am 12:01 AM
The advantages of C#.NET include: 1) Language features, such as asynchronous programming simplifies development; 2) Performance and reliability, improving efficiency through JIT compilation and garbage collection mechanisms; 3) Cross-platform support, .NETCore expands application scenarios; 4) A wide range of practical applications, with outstanding performance from the Web to desktop and game development.


Hot AI Tools

Undresser.AI Undress
AI-powered app for creating realistic nude photos

AI Clothes Remover
Online AI tool for removing clothes from photos.

Undress AI Tool
Undress images for free

Clothoff.io
AI clothes remover

Video Face Swap
Swap faces in any video effortlessly with our completely free AI face swap tool!

Hot Article

Hot Tools

ZendStudio 13.5.1 Mac
Powerful PHP integrated development environment

SecLists
SecLists is the ultimate security tester's companion. It is a collection of various types of lists that are frequently used during security assessments, all in one place. SecLists helps make security testing more efficient and productive by conveniently providing all the lists a security tester might need. List types include usernames, passwords, URLs, fuzzing payloads, sensitive data patterns, web shells, and more. The tester can simply pull this repository onto a new test machine and he will have access to every type of list he needs.

Dreamweaver CS6
Visual web development tools

MinGW - Minimalist GNU for Windows
This project is in the process of being migrated to osdn.net/projects/mingw, you can continue to follow us there. MinGW: A native Windows port of the GNU Compiler Collection (GCC), freely distributable import libraries and header files for building native Windows applications; includes extensions to the MSVC runtime to support C99 functionality. All MinGW software can run on 64-bit Windows platforms.

Notepad++7.3.1
Easy-to-use and free code editor


