Home >Web Front-end >JS Tutorial >Node.js log processing module log4js
Node.js log processing module log4js
- 高洛峰Original
- 2017-01-18 13:00:541852browse
log4js is the premier module for Node.js log processing. Compared with console or TJ debugging, it has its advantages, especially for Node.js projects put into production, the following are indispensable:
Log classification
Log classification
Logdrop
This article will give you a comprehensive introduction to log4js, so that you can use log4js with ease in your project. Development and debugging are easy, and you can better monitor or troubleshoot problems online.
小刀
The following three lines of code show you the simplest usage of log4js:
// file: simplest.js
var log4js = require('log4js');
var logger = log4js.getLogger();
logger.debug("Time:", new Date());
You can get log4js by calling .getLogger() Logger instance. The usage of this instance is consistent with console. You can call .debug (there are also .info, .error and other methods) to output logs.
Run node simplest.js, the output is as follows:
$node simplest.js
[2016-08-21 00:01:24.852] [DEBUG] [default] - Time: 2016-08-20T16:01:24.852Z
Time: 2016-08-20T16:01:24.852Z is the content we want to output, the previous Contains specifiers [2016-08-21 00:01:24.852] [DEBUG] [default] will be listed later.
Is it very simple to use? Well, before we dive into the advanced usage of log4js, let’s first familiarize ourselves with a few concepts in log4js.
Level
This is not difficult to understand, it is the classification of logs. With log classification, log4js can better display logs for us (logs of different levels use different colors in the console, for example, error is usually red). In production, logs can be selectively placed on the disk, for example, to avoid some logs belonging to. Sensitive information used only for debugging was leaked.
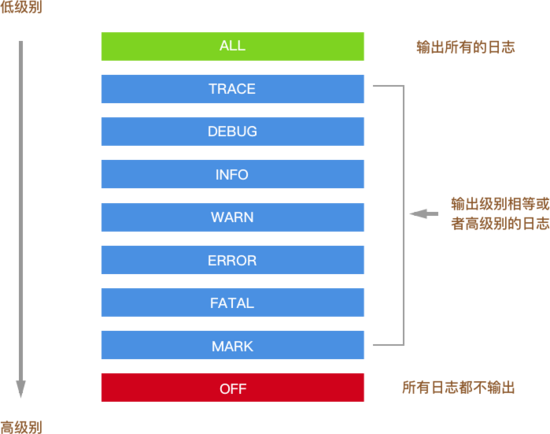
Log4js logs are divided into nine levels. The names and weights of each level are as follows:
{
 ALL: new Level(Number.MIN_VALUE, "ALL"),
 TRACE: new Level(5000, "TRACE"),
 DEBUG: new Level(10000, "DEBUG"),
 INFO: new Level(20000, "INFO"),
 WARN: new Level(30000, "WARN"),
 ERROR: new Level(40000, "ERROR"),
 FATAL: new Level(50000, "FATAL"),
 MARK: new Level(9007199254740992, "MARK"), // 2^53
 OFF: new Level(Number.MAX_VALUE, "OFF")
}
Last picture:

ALL OFF These two levels will not be used directly in business code. The remaining seven correspond to the seven methods of the Logger instance, .trace .debug .info ... . In other words, when you call these methods, it is equivalent to setting the level for these logs. Therefore, the DEBUG in the previous [2016-08-21 00:01:24.852] [DEBUG] [default] - Time: 2016-08-20T16:01:24.852Z is the level of this log.
Type
log4js Another concept is category (type). You can set the type of a Logger instance to distinguish logs according to another dimension:
// file: set-catetory.js
var log4js = require('log4js');
var logger = log4js.getLogger('example');
logger.debug("Time:", new Date());
When obtaining a Logger instance through getLogger, the only parameter that can be passed is loggerCategory (such as 'example'). Use this parameter to specify which category the Logger instance belongs to. This is the same as TJ's debug:
var debug = require('debug')('worker');

setInterval(function(){
 debug('doing some work');
}, 1000);
'worker' in debug is also used to classify logs. Okay, come back and run node set-catetory.js:
[2016-08-21 01:16:00.212] [DEBUG] example - Time: 2016-08-20T17:16:00.212Z
The only difference from the previous [2016-08-21 00:01:24.852] [DEBUG] [default] - Time: 2016-08-20T16:01:24.852Z is that [default] becomes example .
What is the use of category? It is more flexible than level and provides a second dimension of distinction for logs. For example, you can set a different category for each file, such as in set-catetory In .js:
// file: set-catetory.js
var log4js = require('log4js');
var logger = log4js.getLogger('set-catetory.js');
logger.debug("Time:", new Date());
can be retrieved from the log [2016-08-21 01:24:07.332] [DEBUG] set-catetory.js - Time: 2016-08-20T17: 24:07.331Z It can be seen that this log comes from the set-catetory.js file. Or use different categories for different node packages, so that you can distinguish which module the logs come from.
Appender
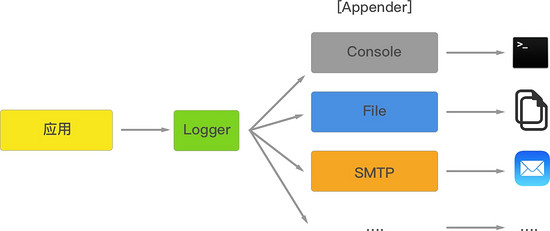
Okay, now the log has levels and categories, which solves the problem of grading and classifying logs at the entrance. In log4js, the problem of log export (that is, the log is output to Where) is solved by Appender.
Default appender
The following are the default appender settings inside log4js:
// log4js.js
defaultConfig = {
 appenders: [{
  type: "console"
 }]
}
As you can see, when there is no configuration for log4js, By default, logs are output to the console.
Set your own appender
We can set the appender we want through log4js.configure.
// file: custom-appender.js
var log4js = require('log4js');
log4js.configure({
 appenders: [{
  type: 'file',
  filename: 'default.log'
 }]
})
var logger = log4js.getLogger('custom-appender');
logger.debug("Time:", new Date());
In the above example, we output the log to a file, run the code, and log4js creates a file named default.log in the current directory, [2016-08-21 08 :43:21.272] [DEBUG] custom-appender - Time: 2016-08-21T00:43:21.272Z is output to this file.
The appenders provided by log4js
Console and File are both appenders provided by log4js. In addition, there are:
DateFile: The log is output to a file, and the log file can be installed Specific date pattern rolling, for example, output to default-2016-08-21.log today, output to default-2016-08-22.log tomorrow;
SMTP: output log to email;
Mailgun: through Mailgun The API outputs logs to Mailgun;
levelFilter can filter by level;
and other appenders, you can see the full list here.

Filter levels and categories
我们可以调整 appender 的配置,对日志的级别和类别进行过滤:
// file: level-and-category.js
var log4js = require('log4js');
log4js.configure({
 appenders: [{
  type: 'logLevelFilter',
  level: 'DEBUG',
  category: 'category1',
  appender: {
   type: 'file',
   filename: 'default.log'
  }
 }]
})
var logger1 = log4js.getLogger('category1');
var logger2 = log4js.getLogger('category2');
logger1.debug("Time:", new Date());
logger1.trace("Time:", new Date());
logger2.debug("Time:", new Date());
运行,在 default.log 中增加了一条日志:
[2016-08-21 10:08:21.630] [DEBUG] category1 - Time: 2016-08-21T02:08:21.629Z
来看一下代码:
使用 logLevelFilter 和 level 来对日志的级别进行过滤,所有权重大于或者等于 DEBUG 的日志将会输出。这也是之前提到的日志级别权重的意义;
通过 category 来选择要输出日志的类别, category2 下面的日志被过滤掉了,该配置也接受一个数组,例如 ['category1', 'category2'] ,这样配置两个类别的日志都将输出到文件中。
Layout
Layout 是 log4js 提供的高级功能,通过 layout 我们可以自定义每一条输出日志的格式。log4js 内置了四中类型的格式:
messagePassThrough:仅仅输出日志的内容;
basic:在日志的内容前面会加上时间、日志的级别和类别,通常日志的默认 layout;
colored/coloured:在 basic 的基础上给日志加上颜色,appender Console 默认使用的就是这个 layout;
pattern:这是一种特殊类型,可以通过它来定义任何你想要的格式。
一个 pattern 的例子:
// file: layout-pattern.js
var log4js = require('log4js');
log4js.configure({
 appenders: [{
  type: 'console',
  layout: {
   type: 'pattern',
   pattern: '[%r] [%[%5.5p%]] - %m%n'
  }
 }]
})
var logger = log4js.getLogger('layout-pattern');
logger.debug("Time:", new Date());
%r %p $m $n 是 log4js 内置的包含说明符,可以借此来输出一些 meta 的信息,更多细节,可以参考 log4js 的 文档 。
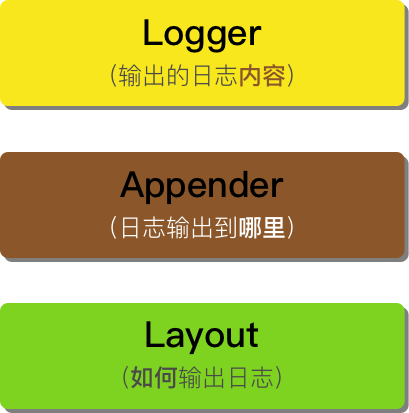
一张图再来说明一下,Logger、Appender 和 Layout 的定位。

实战:输出 Node 应用的 ACCESS 日志 access.log
为了方便查问题,在生产环境中往往会记录应用请求进出的日志。那使用 log4js 怎么实现呢,直接上代码:
// file: server.js
var log4js = require('log4js');
var express = require('express');

log4js.configure({
 appenders: [{
  type: 'DateFile',
  filename: 'access.log',
  pattern: '-yyyy-MM-dd.log',
  alwaysIncludePattern: true,
  category: 'access'
 }]
});

var app = express();
app.use(log4js.connectLogger(log4js.getLogger('access'), { level: log4js.levels.INFO }));
app.get('/', function(req,res) {
 res.send('前端外刊评论');
});
app.listen(5000);
看看我们做了哪些事情:
配置了一个 appender,从日志中选出类别为 access 的日志,输出到一个滚动的文件中;
log4js.getLogger('access') 获取一个类别为 access 的 Logger 实例,传递给 log4js.connectLogger 中间件,这个中间件收集访问信息,通过这个实例打出。
启动服务器,访问 http://localhost:5000,你会发现目录中多了一个名为 access.log-2016-08-21.log 的文件,里面有两条日志:
[2016-08-21 14:34:04.752] [INFO] access - ::1 - - "GET / HTTP/1.1" 200 18 "" "Mozilla/5.0 (Macintosh; Intel Mac OS X 10_11_0) AppleWebKit/537.36 (KHTML, like Gecko) Chrome/52.0.2743.116 Safari/537.36"
[2016-08-21 14:34:05.002] [INFO] access - ::1 - - "GET /favicon.ico HTTP/1.1" 404 24 "http://localhost:5000/" "Mozilla/5.0 (Macintosh; Intel Mac OS X 10_11_0) AppleWebKit/537.36 (KHTML, like Gecko) Chrome/52.0.2743.116 Safari/537.36"
通过 log4js 日志的分类和appender功能,我们把访问日志输出到了一个滚动更新的文件之中。
总结
本文为大家全面地介绍了 log4js 的用法,与 console 或者简单的日志工具相比,log4js 使用起来更复杂,当然功能更强大,适合生产级应用的使用。如果大家有兴趣的话,请留言告诉外刊君,接下来可能为大家介绍如何在 Node 应用中做配置管理。
更多Node.js 日志处理模块log4js相关文章请关注PHP中文网!
Related articles
See more- An in-depth analysis of the Bootstrap list group component
- Detailed explanation of JavaScript function currying
- Complete example of JS password generation and strength detection (with demo source code download)
- Angularjs integrates WeChat UI (weui)
- How to quickly switch between Traditional Chinese and Simplified Chinese with JavaScript and the trick for websites to support switching between Simplified and Traditional Chinese_javascript skills

