






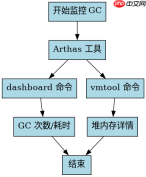
使用 arthas 监控 java 垃圾回收(gc)最直接的方法是使用 dashboard 命令查看实时概览,或使用 vmtool 命令获取堆内存的具体统计信息。通过 dashboard 可以直观看到 gc 的次数和耗时,而 vmtool 则能提供更详细的堆内存分布数据。这些工具无需修改代码即可在运行中生效。
如何查看实时的 GC 次数与耗时
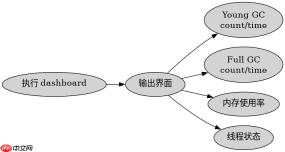
要查看实时的 GC 情况,应使用 dashboard 命令。该命令会显示当前进程的基本信息、线程状态以及内存使用情况,其中包含 Young GC 和 Full GC 的累计次数及耗时。这是排查 GC 问题最快速的入口。
import java.util.ArrayList;
import java.util.List;

public class GcMonitorDemo {
    public static void main(String[] args) throws InterruptedException {
        // 模拟一些内存分配以触发 GC
        List<byte> list = new ArrayList();
        for (int i = 0; i <p>预期结果:在 Arthas 控制台执行 <code>dashboard</code> 后,输出中将包含 <code>Young GC</code> 和 <code>Full GC</code> 两行,分别显示其总次数和总耗时(秒)。例如:<code>Young GC: count=5, time=0.01s</code>。</p>
<h2>如何获取堆内存的详细统计信息</h2>
<p>如果需要更细致的堆内存数据,可以使用 <code>vmtool</code> 命令配合 <code>-x</code> 参数或查询特定的 JVM 内部对象。虽然 <code>vmtool</code> 主要用于获取 Java 对象,但结合 <code>ognl</code> 表达式可以访问 JVM 的 MBean 信息,从而获取更详细的 GC 统计。不过,更常用的方式是直接解析 <code>dashboard</code> 的输出或使用 <code>thread</code> 命令辅助分析。</p><div class="aritcle_card flexRow artxards">
											<div class="artcardd flexRow">
												<a class="aritcle_card_img" rel="nofollow" href="/xiazai/skill13505" title="FilePond 灵活的 JavaScript 文件上传库"><img
														src="https://img.php.cn/upload/skill/001/246/273/6adaf20e695c2374.jpg" alt="FilePond 灵活的 JavaScript 文件上传库" onerror="this.onerror='';this.src='/static/lhimages/moren/morentu.png'" ></a>
												<div class="aritcle_card_info flexColumn">
													<a rel="nofollow" href="/xiazai/skill13505" title="FilePond 灵活的 JavaScript 文件上传库" class="overflowclass">FilePond 灵活的 JavaScript 文件上传库</a>
													<p class="overflowclass">FilePond 是一个 JavaScript 文件上传库,支持通过拖拽、粘贴和 API 方式处理文件、目录、URL 和 Data URI。它包含内置的图像优化功能、异步分块上传功能,并提供了适用于 React、Vue、Angular 和 Svelte 的适配器。</p>
												</div>
												<a rel="nofollow" href="/xiazai/skill13505" title="FilePond 灵活的 JavaScript 文件上传库" class="aritcle_card_btn flexRow flexcenter"><b></b><span>下载</span>
												</a>
											</div>
										</div>
<p><img src="https://img.php.cn/upload/article/001/242/473/179523369851550.png?x-oss-process=image/resize,p_40" alt="Java 垃圾回收 中 怎么使用Arthas监控GC"></p>
<pre class="brush:php;toolbar:false;">import java.lang.management.ManagementFactory;
import java.lang.management.GarbageCollectorMXBean;
import java.util.List;

public class GcStatsDemo {
    public static void main(String[] args) throws InterruptedException {
        List<garbagecollectormxbean> gcBeans = ManagementFactory.getGarbageCollectorMXBeans();
        for (GarbageCollectorMXBean bean : gcBeans) {
            System.out.println("Name: " + bean.getName());
            System.out.println("Collection Count: " + bean.getCollectionCount());
            System.out.println("Collection Time: " + bean.getCollectionTime());
        }
        Thread.sleep(60000);
    }
}</garbagecollectormxbean>
预期结果:程序启动后,控制台将打印出每个 GC 收集器的名称、累计收集次数和累计收集时间。这与 dashboard 中显示的数据一致,但可以通过代码逻辑进行自定义处理或日志记录。
当 Young GC 频繁发生时如何定位原因
当 dashboard 显示 Young GC 频繁发生且耗时较长时,通常意味着堆内存不足或存在内存泄漏。此时应结合 heapdump 命令生成堆转储文件,并使用外部工具(如 Eclipse MAT)进行分析。同时,可以使用 thread 命令查看当前线程状态,排除因线程阻塞导致的 GC 停顿延长。
Java免费学习笔记:立即使用
解锁 Java 大师之旅:从入门到精通的终极指南


