Home >Web Front-end >JS Tutorial >Detailed example of how to use echart plug-in in AngularJS
Detailed example of how to use echart plug-in in AngularJS
- 高洛峰Original
- 2016-12-08 16:28:501285browse
Step 1: Preparation
The first thing we have to do is introduce the dependencies we need into our project. Assuming that you have already installed node and cnpm on your computer, you only need to use the console to install it on your computer. Use the following command in the project directory
1. cnpm install angular --save
2. cnpm install echarts --save
After the installation is complete, you will get a folder named node_modules, and everything we need is in it. When everything is ready, we can start our development .
Step 2: Development
I think the best way to use other plug-ins in angular is to introduce them in the project in the form of instructions. This has many benefits, the most obvious of which is that when the project needs to be introduced When multiple plug-ins are used, various instructions can be used to separate them, and it also has the componentization feature of being developed once and used everywhere.
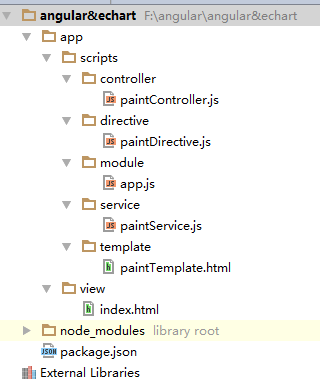
First I created the angular project in the following directory

In which index.html is the main page, we need to use script tags to introduce all the dependencies that will be used, but too many script tags will drag down the entire page Loading speed, if you need to optimize it, you can use webpack to package them. If you are interested, you can go and learn about it yourself. For angular, its project will automatically generate a scope. When you want to use other independent plug-ins in the angular project, usually the first thing we do is to introduce this plug-in into the scope of angular, so in the project In it, I created a factory to pass echarts into the scope of angular
.factory('echarts',function(){
 return echarts;
});
At this time, we only need to directly reference the previously created factory named echarts in the created instruction. We can directly reference it in the instruction. Use this plug-in from echarts.
The code during the test is as follows
.directive('paintDirective',['echarts',function(echarts){
 console.log(echarts);
 return {
  restrict:'E',
  controller: ['$scope','$rootScope',function($scope,$rootScope){
   console.log('123');
  }],
  templateUrl:'../scripts/template/paintTemplate.html',
 }
}]);
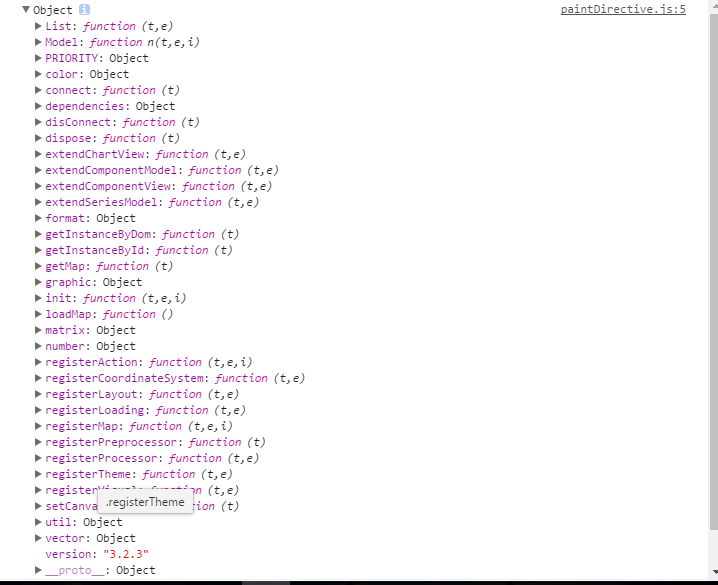
From the output in the console, we can easily see that echarts has been introduced into the instruction. At this time, we can use echarts to operate in the angular project.

Related articles
See more- An in-depth analysis of the Bootstrap list group component
- Detailed explanation of JavaScript function currying
- Complete example of JS password generation and strength detection (with demo source code download)
- Angularjs integrates WeChat UI (weui)
- How to quickly switch between Traditional Chinese and Simplified Chinese with JavaScript and the trick for websites to support switching between Simplified and Traditional Chinese_javascript skills

