






JavaScript 运行时性能分析怎么查看 Scripting 耗时
在 chrome devtools 的 performance 面板中,scripting 耗时通过统计主线程上执行 javascript 代码所花费的时间来体现。要查看这一数据,你需要录制一段性能测试,然后在生成的火焰图(flame chart)或调用树(call tree)中关注 scripting 列或 self time 列。这些数值直接反映了引擎解析和执行 js 代码的开销,是定位性能瓶颈的关键指标。

如何在火焰图中识别具体的脚本执行块
在火焰图中,每一行代表一个调用栈帧,而 Scripting 时间通常隐含在条形的宽度中。要识别具体是哪个函数或代码块占用了时间,你可以点击对应的条形,查看右侧的详细信息面板。这里会显示函数名、源码位置以及该帧的自耗时(Self Time)。如果某个函数的 Self Time 很高,说明它内部进行了大量的计算或 DOM 操作,而不是仅仅等待异步任务。
function heavyComputation() {
    let sum = 0;
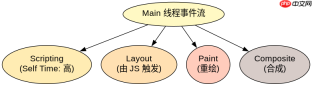
    for (let i = 0; i <h2>如何区分 Scripting 与布局绘制时间</h2><p>在性能分析中,区分 <code>Scripting</code> 和 <code>Layout/Style</code> 至关重要。Scripting 阶段主要涉及 JS 逻辑执行,而 Layout 阶段则计算元素几何位置。如果在火焰图中看到大量的 <code>Layout</code> 条形紧随 <code>Scripting</code> 之后,说明 JS 修改了 DOM 样式并触发了重排。你可以通过观察 <code>Main</code> 线程的时间轴,将鼠标悬停在不同的颜色区域:蓝色通常代表 JS 执行,绿色代表样式计算,黄色代表布局。这种视觉区分能帮助你快速定位是代码逻辑慢,还是 DOM 操作引发了昂贵的重绘。</p><div class="aritcle_card flexRow artxards">
											<div class="artcardd flexRow">
												<a class="aritcle_card_img" rel="nofollow" href="/xiazai/skill13095" title="Build Java agent transport gateways with Atmosphere"><img
														src="https://img.php.cn/upload/skill/001/246/273/6adaf20e352aa140.jpg" alt="Build Java agent transport gateways with Atmosphere" onerror="this.onerror='';this.src='/static/lhimages/moren/morentu.png'" ></a>
												<div class="aritcle_card_info flexColumn">
													<a rel="nofollow" href="/xiazai/skill13095" title="Build Java agent transport gateways with Atmosphere" class="overflowclass">Build Java agent transport gateways with Atmosphere</a>
													<p class="overflowclass">使用Atmosphere构建通过WebSocket、SSE、gRPC、WebTransport、MCP、A2A和AG-UI流传输的JVM代理网关,并带有治理钩子。</p>
												</div>
												<a rel="nofollow" href="/xiazai/skill13095" title="Build Java agent transport gateways with Atmosphere" class="aritcle_card_btn flexRow flexcenter"><b></b><span>下载</span>
												</a>
											</div>
										</div><p><img src="https://img.php.cn/upload/article/001/242/473/179489023837268.png?x-oss-process=image/resize,p_40" alt="JavaScript 运行时性能分析怎么查看 Scripting 耗时"></p><pre class="brush:php;toolbar:false;">// 模拟触发重排的 JS 操作
const div = document.getElementById('box');
div.style.width = '100px'; // 触发 Style 计算
div.style.height = '100px'; // 触发 Layout 计算
// 在 Performance 面板中,这两行代码会导致 Scripting 后紧跟 Layout 条形
基于程序中某个输入、条件或结果的具体问题
当程序中存在大量递归或复杂循环时,Scripting 耗时可能会显著增加,甚至导致主线程阻塞。例如,在处理大型数组排序或深度遍历 DOM 树时,JS 引擎需要消耗大量 CPU 周期。此时,你应该关注 Scripting 列的累计值,并结合 Call Tree 视图,使用 Search 功能过滤出高耗时的函数。如果发现某个特定输入导致耗时激增,可以考虑使用 Web Workers 将计算卸载到后台线程,从而保持主线程的响应性。
Java免费学习笔记:立即使用
解锁 Java 大师之旅:从入门到精通的终极指南