Home >Web Front-end >H5 Tutorial >html5-- canvas
html5-- canvas
- 高洛峰Original
- 2016-10-12 10:11:161544browse
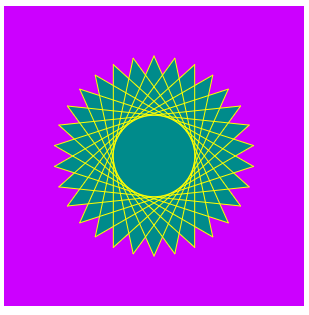
绘制普通直线,先看效果图:

实现代码如下:
<!DOCTYPE html>
<html>
<head>
<meta charset="UTF-8">
<title></title>
<script>
function drawGraph(id)
{
var canvas=document.getElementById(id);
var context=canvas.getContext("2d");
context.fillStyle="#CC00FF" //最外层canvas颜色
context.fillRect(0,0,300,300)//最外层canvas区域
context.beginPath()
context.fillStyle="#008B8B"//填充颜色
context.strokeStyle="#FFFF00"//线的颜色
var dx=150
var dy=150
var s=100
var dig=Math.PI/15*11
for(var i=0;i<30;i++)
{
var x=Math.sin(i*dig)
var y=Math.cos(i*dig)
context.lineTo(dx+x*s,dy+y*s)
}
context.closePath()//关闭路径
context.fill()//填充颜色
context.stroke()
}
</script>
</head>
<body onload="drawGraph('canvasId')">
<canvas id="canvasId" width="300" height="400"></canvas>
</body>
</html>绘制贝塞尔曲线
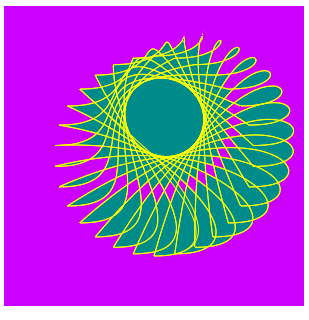
效果图如下:

代码如下:
<!DOCTYPE html>
<html>
<head>
<meta charset="UTF-8">
<title></title>
<script>
function drawGraph(id)
{
var canvas=document.getElementById(id);
var context=canvas.getContext("2d");
context.fillStyle="#CC00FF"
context.fillRect(0,0,300,300)
context.beginPath()
context.fillStyle="#008B8B"
context.strokeStyle="#FFFF00"
var dx=150
var dy=150
var s=100
var dig=Math.PI/15*11
context.moveTo(dx,dy)
for(var i=0;i<60;i++)
{
var x=Math.sin(i*dig)
var y=Math.cos(i*dig)
context.bezierCurveTo(dx+x*s,dy+y*s-100,dx+x*s+100,dy+y*s,dx+x*s,dy+y*s)//贝塞尔绘制函数
}
context.closePath()
context.fill()
context.stroke()
}
</script>
</head>
<body onload="drawGraph('canvasId')">
<canvas id="canvasId" width="300" height="400"></canvas>
</body>
</html>关于了解的html5的基本知识点就到这里了,毕竟项目中没有去使用,出于个人闲来无事有个大体了解.并且都很基本,其实这些基本的知识点感觉没必要花费这么多精力去关注,这个时间个人感觉花的太多,完全可以找个小demo去研究,这样驱动的去学习效果会更好,先到这里了,准备投入到下一阶段其他开发知识点的学习中.
Statement:
The content of this article is voluntarily contributed by netizens, and the copyright belongs to the original author. This site does not assume corresponding legal responsibility. If you find any content suspected of plagiarism or infringement, please contact admin@php.cn
Previous article:【HTML5】Canvas implements magnifying glass effectNext article:【HTML5】Canvas implements magnifying glass effect
Related articles
See more- AlloyTouch full-screen scrolling plug-in creates a smooth H5 page in 30 seconds
- HTML5 actual combat and analysis of touch events (touchstart, touchmove and touchend)
- Detailed explanation of image drawing examples in HTML5 canvas 9
- Regular expressions and new HTML5 elements
- How to combine NodeJS and HTML5 to drag and drop multiple files to upload to the server

