Home >Web Front-end >JS Tutorial >ie tool for debugging javascript_javascript skills
ie tool for debugging javascript_javascript skills
- WBOYWBOYWBOYWBOYWBOYWBOYWBOYWBOYWBOYWBOYWBOYWBOYWBOriginal
- 2016-05-16 18:53:311318browse
Friends who do web development know that debugging JS programs is quite depressing, because first of all, the syntax of this language is relatively flexible, it is a weakly typed scripting language, and many errors are uncontrollable. Apart from these, the most painful thing is There are no good debugging tools. The current situation is slightly better than before. There is also firebug under Firefox. This is indeed a good js debugging tool, but it is very troublesome to use under IE and the effect is very poor. I have been I was struggling to find a good js debugging tool under IE that can automatically capture errors and locate the location and cause. I didn't expect to find such a good tool by accident today. I didn't dare to keep it privately, so I shared it. I hope it can be useful to everyone. Bringing convenience to web developers
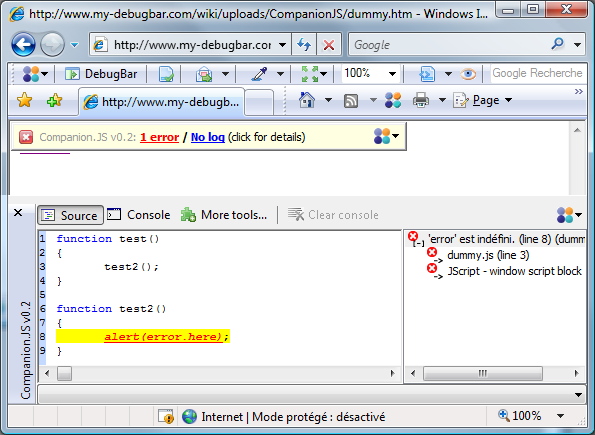
The name of this tool is Companion.JS. Please note that this is not a js file, but is a name. It is installed and used as a plug-in for IE, and it needs to be used in conjunction with Microsoft Script Debugger. By installing this tool, but when an error occurs on the page, a small error message will pop up in the upper left corner. Clicking it will display it below IE. An error console, just like the firebug console under FF. The error message is very detailed.
The following is an error message example from the official website: 
Official website address: http://www.my-debugbar.com/wiki/CompanionJS/HomePage
The specific usage method is:
1. First download the Companion.JS installation file and then install it.
2. Download and install Microsoft Script Debugger. If your machine has already been installed, you can skip this step.
3. Open the IE menu "Tools" - "Internet Options" - "Advanced", find "Disable script debugging (Internet Explorer)" and "Disable script debugging (outside Internet Explorer)" and change the two Uncheck all the check boxes in front of the options, and then restart IE.
4. Enter in Ie: http://www.my-debugbar.com/wiki/uploads/CompanionJS/dummy.htm, Then click the click me link. If a small error message pops up in the upper left corner or an error message appears in the console below, it means that you have successfully installed it.
Tips: Microsoft Script Debugger can be downloaded from the MS official website (it needs to be authenticated by the MS operating system): http://www.microsoft. com/downloads/details.aspx?displaylang=zh-cn&FamilyID=E606E71F-BA7F-471E-A57D-F2216D81EC3D#filelistor enter "Microsoft Script Debugger download" in baidu to find it.
Related articles
See more- An in-depth analysis of the Bootstrap list group component
- Detailed explanation of JavaScript function currying
- Complete example of JS password generation and strength detection (with demo source code download)
- Angularjs integrates WeChat UI (weui)
- How to quickly switch between Traditional Chinese and Simplified Chinese with JavaScript and the trick for websites to support switching between Simplified and Traditional Chinese_javascript skills

