Home >Web Front-end >JS Tutorial >Aptana debugging javascript graphic tutorial_javascript skills
Aptana debugging javascript graphic tutorial_javascript skills
- WBOYWBOYWBOYWBOYWBOYWBOYWBOYWBOYWBOYWBOYWBOYWBOYWBOriginal
- 2016-05-16 18:40:451177browse
The prerequisite is to install the Firebug plug-in and aptanadebugger plug-in. Their download addresses are as follows:
http://getfirebug.com/releases/firebug/1.2/firebug-1.2 .0.xpi
http://firefox.aptana.com/update/aptanadebugger.xpi
Start debugging:
Select the html file you need to debug, right-click "Debug..." under "Debug As", and select "Debug..." in the left menu Web Browser", be sure to fill in the correct path to the firefox.exe file in "Browser executable" in the "Main" tab on the right, and leave other defaults as shown below:
 Click the "Debug" button to enter the debug view (aptana will open the firefox browser at the same time), as shown below:
 In addition:
If there is no response when running debug, you can right-click "Relaunch" to try, as shown in the picture:
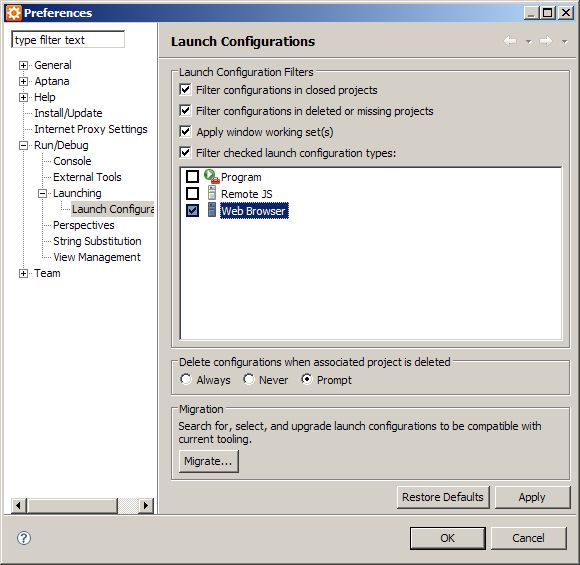
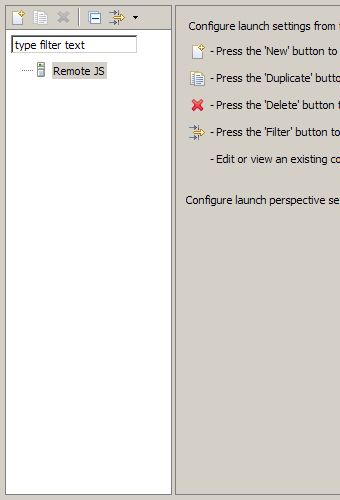
 Sometimes there is no "Web Browser" menu in the Debug option panel There is only the "Remote JS" menu, as shown in the picture:
 The solution is as follows:
"Window" -> "Preferences" -> "Run/Debug" - > Launching -> Launch Configuration
Uncheck the "Web Browser" on the right.
http://getfirebug.com/releases/firebug/1.2/firebug-1.2 .0.xpi
http://firefox.aptana.com/update/aptanadebugger.xpi
Start debugging:
Select the html file you need to debug, right-click "Debug..." under "Debug As", and select "Debug..." in the left menu Web Browser", be sure to fill in the correct path to the firefox.exe file in "Browser executable" in the "Main" tab on the right, and leave other defaults as shown below:
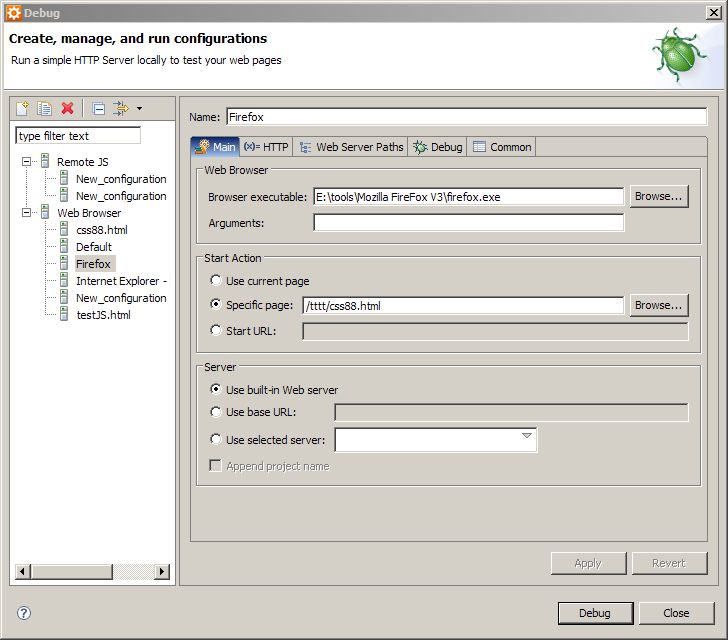 Click the "Debug" button to enter the debug view (aptana will open the firefox browser at the same time), as shown below:
 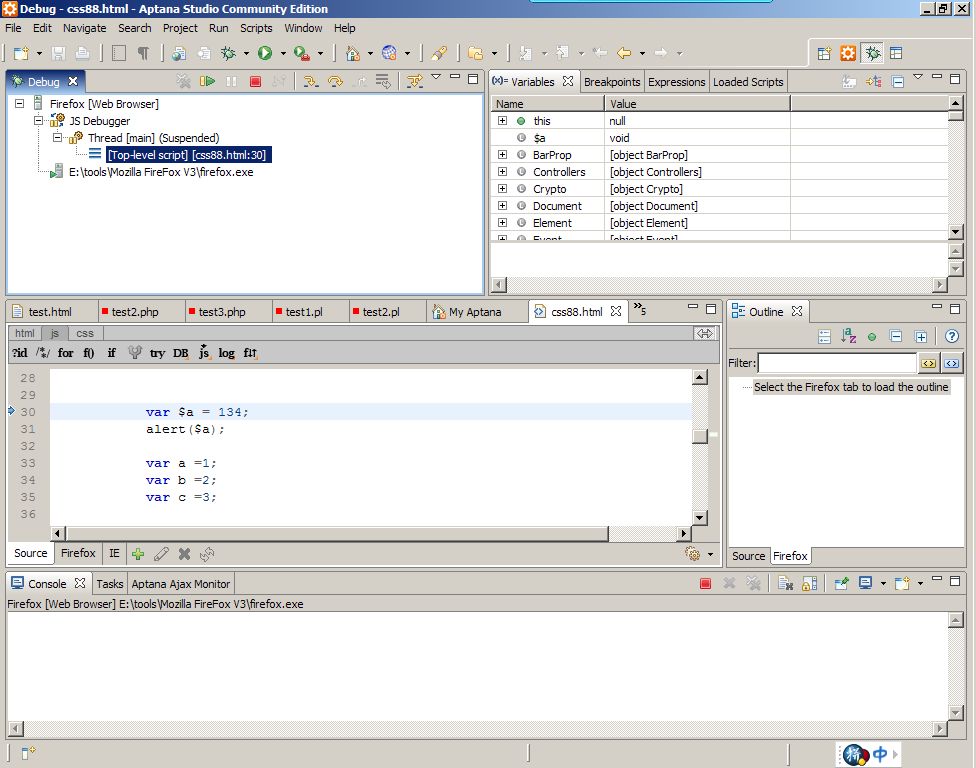 In addition:
 If there is no response when running debug, you can right-click "Relaunch" to try, as shown in the picture:
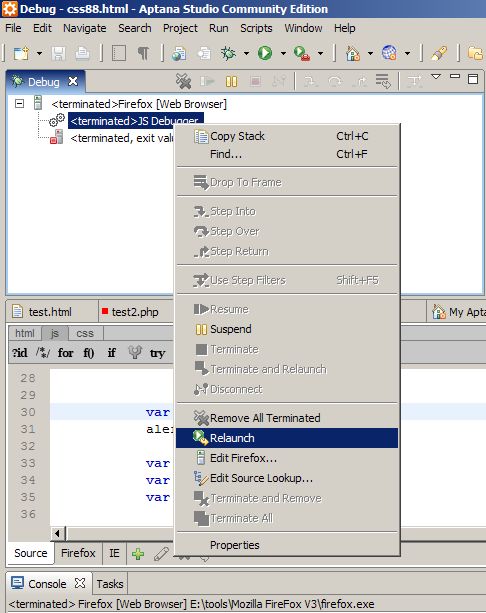 Sometimes there is no "Web Browser" menu in the Debug option panel There is only the "Remote JS" menu, as shown in the picture:
  The solution is as follows:
 "Window" -> "Preferences" -> "Run/Debug" - > Launching -> Launch Configuration
Uncheck the "Web Browser" on the right.
Statement:
The content of this article is voluntarily contributed by netizens, and the copyright belongs to the original author. This site does not assume corresponding legal responsibility. If you find any content suspected of plagiarism or infringement, please contact admin@php.cn
Previous article:Jquery selector $implementation principle_jqueryNext article:Jquery selector $implementation principle_jquery
Related articles
See more- An in-depth analysis of the Bootstrap list group component
- Detailed explanation of JavaScript function currying
- Complete example of JS password generation and strength detection (with demo source code download)
- Angularjs integrates WeChat UI (weui)
- How to quickly switch between Traditional Chinese and Simplified Chinese with JavaScript and the trick for websites to support switching between Simplified and Traditional Chinese_javascript skills


