


There are multiple methods to track CPU usage on a Mac, with the most popular being Activity Monitor for the graphical interface and htop or top for command line users. While Activity Monitor can display an optional core graph and htop shows CPU core activity, there's a less familiar command line tool named powermetrics that also provides this data.
If you're an experienced command line user and unfamiliar with powermetrics, you're not alone. I too was unaware of it until I came across an article on eclecticlight.co that mentioned various methods to view CPU core activity, including the 'powermetrics' command line tool. This piqued my interest, and I decided to explore it further. Sharing knowledge is beneficial, so let's delve into how you can utilize this command.
The powermetrics command is compatible with both ARM and Intel Macs, but it offers additional features for Apple Silicon Macs, such as insights into GPU activity and efficiency cores.
Using powermetrics to Monitor Individual CPU Core Activity on Mac
To use powermetrics, you must run it with root privileges, so all commands will start with sudo.
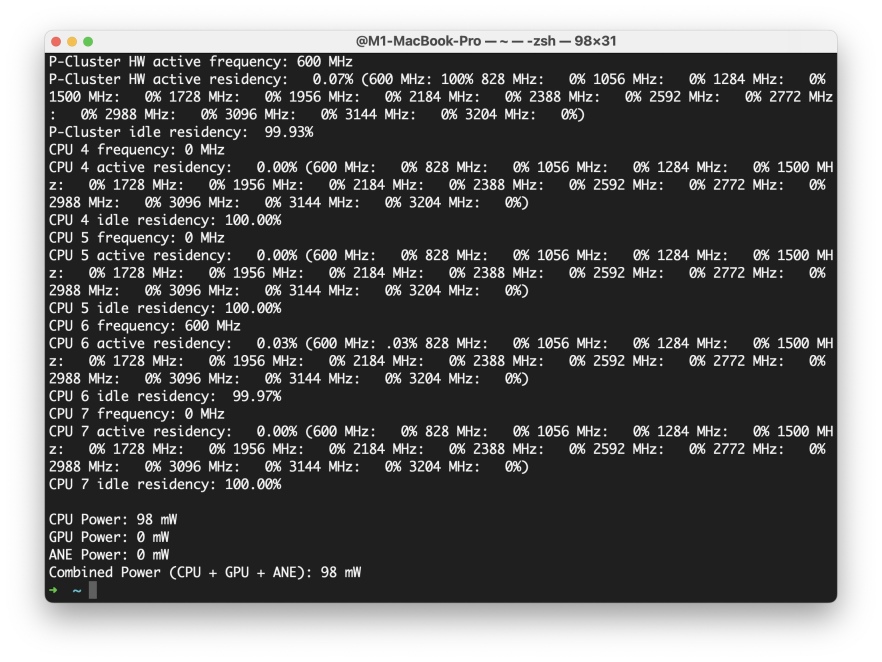
The simplest form of the powermetrics command is as follows, which will provide a continuous stream of data about all power metrics for CPU and GPU on the Mac, including individual core activity:
sudo powermetrics
You can also view a summary of CPU and GPU power usage with: sudo powermetrics --samplers cpu_power,gpu_power --show-usage-summary
What sets powermetrics apart from other well-known tools like htop, top, or even Activity Monitor is its continuous output of new information on new lines, rather than just refreshing CPU core activity on a single screen. This can make powermetrics somewhat overwhelming, and it might consume significant memory if left running for a long time. There are several ways to manage this, such as, as suggested by EclecticLight, directing the output to a text file for later analysis. An example command is:
sudo powermetrics -i 100 -o powermetrics.txt -n 10 -s cpu_power
This command generates a text file called 'powermetrics' with the last 10 entries related to cpu_power (which details Core activity) sampled every 100ms.
Thanks to eclecticlight.co for highlighting this intriguing new command line tool!
Personally, I frequently use htop and/or Activity Monitor. I keep the latter open constantly with the Dock CPU Monitor enabled, and it's easily accessible via a keyboard shortcut for quick launches when needed. When working at the command line, I often have htop running in another Terminal window.

The above is the detailed content of How to See Individual Core CPU Usage on Mac with powermetrics. For more information, please follow other related articles on the PHP Chinese website!

 How to Install MacOS Sequoia Public BetaMay 15, 2025 am 10:39 AM
The MacOS Sequoia public beta program is now available, providing Mac users with an early chance to explore the new major MacOS system software update. However, it's important to note that, like all beta versions, MacOS Sequoia public beta may be mor
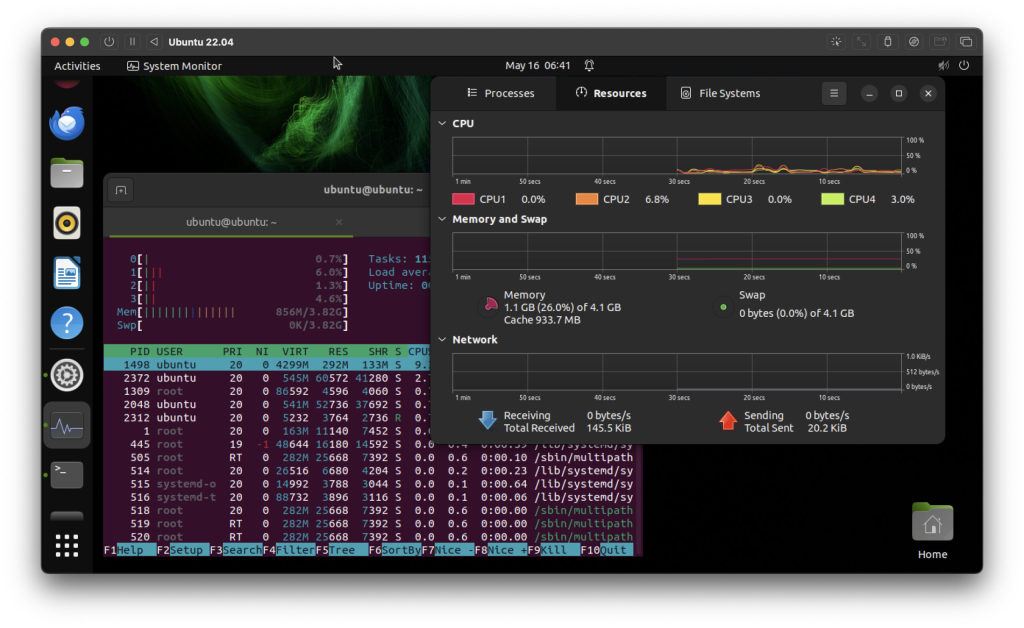 How to Run Ubuntu Linux on Apple Silicon MacMay 15, 2025 am 10:37 AM
Interested in running Ubuntu Linux on your Apple Silicon Mac? It's now simpler than ever to run Ubuntu alongside MacOS without the hassle of partitioning, dual booting, or risking your Mac's operating system. Thanks to virtual machine technology, you
 How to See Individual Core CPU Usage on Mac with powermetricsMay 15, 2025 am 10:31 AM
There are multiple methods to track CPU usage on a Mac, with the most popular being Activity Monitor for the graphical interface and htop or top for command line users. While Activity Monitor can display an optional core graph and htop shows CPU core
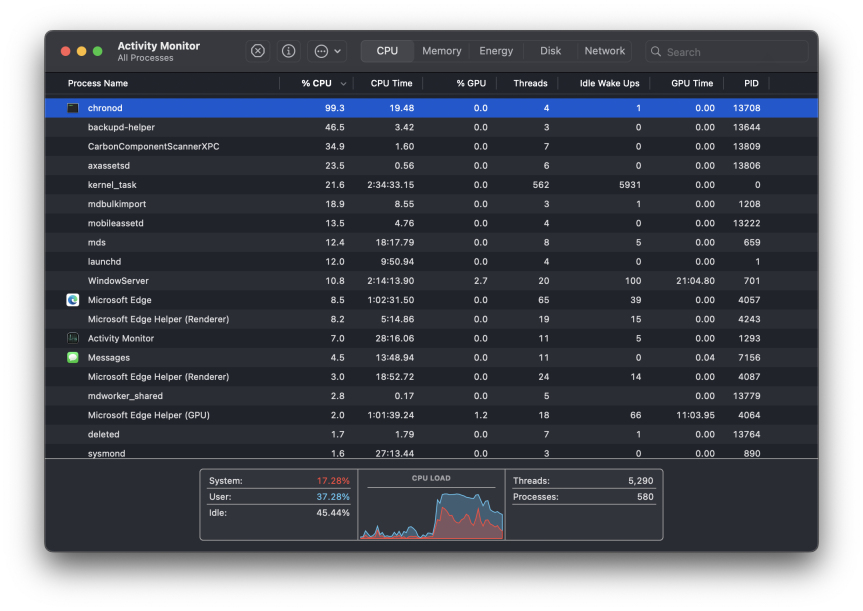 chronod on Mac – High CPU Use & Network Access Requests ExplainedMay 15, 2025 am 10:18 AM
Some Mac users occasionally find that the "chronod" process in MacOS either consumes a lot of system resources or requests access to a network connection. Sometimes, chronods are also marked by overly alert antivirus applications. While many people will ignore this situation, there are also curious Mac users who actively explore what specific processes that consume a lot of resources are, or what the intentions are of a process that requires or requires Internet access. So, what is chronod on Mac? Why does it use high CPU and system resources? Why does it require network access? Let's dive into the chronod process to better understand its functionality. What is chronod? The chronod process is
 Security Agent on Mac: What Is It & What Does It Do on MacBook Air/Pro?May 15, 2025 am 10:11 AM
What is Security Agent on MacSecurity Agent on Mac functions as a background process responsible for managing user authentication, system security notifications, and requests for application permissions. It collaborates with macOS's Security Server t
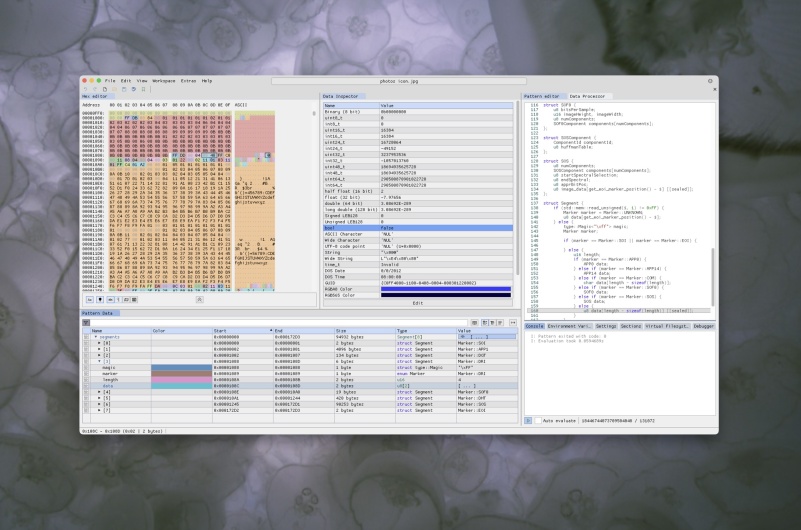 2 of the Best Hex Editors for Mac: ImHex & Hex FiendMay 15, 2025 am 10:05 AM
Hex editors are specialized software tools designed for viewing and editing hexadecimal data as well as raw binary data within files. These tools are indispensable for programmers, developers, and reverse engineers who need to inspect, debug, and ana
 MacOS Sequoia 15 Beta 4 Available to DownloadMay 15, 2025 am 09:54 AM
Apple has unveiled the fourth beta release of MacOS Sequoia 15 for those engaged in the macOS Sequoia developer beta testing program. Typically, the corresponding build for public beta testers, labeled as macOS Sequoia public beta 2, is released shor
 FaceTime Not Working on Mac? Here's How to Fix ItMay 15, 2025 am 09:49 AM
Apple's FaceTime application is designed to connect Apple users seamlessly, offering features such as dual-camera support on smartphones for enhanced video chat experiences.Occasionally, though, FaceTime might not function as intended. This article d


Hot AI Tools

Undresser.AI Undress
AI-powered app for creating realistic nude photos

AI Clothes Remover
Online AI tool for removing clothes from photos.

Undress AI Tool
Undress images for free

Clothoff.io
AI clothes remover

Video Face Swap
Swap faces in any video effortlessly with our completely free AI face swap tool!

Hot Article
Hot Tools

Atom editor mac version download
The most popular open source editor

WebStorm Mac version
Useful JavaScript development tools

SublimeText3 English version
Recommended: Win version, supports code prompts!

Dreamweaver Mac version
Visual web development tools

Safe Exam Browser
Safe Exam Browser is a secure browser environment for taking online exams securely. This software turns any computer into a secure workstation. It controls access to any utility and prevents students from using unauthorized resources.

