


Data dashboards are essential for modern businesses, offering a concise overview of key performance indicators (KPIs). This article showcases 20 diverse Power BI dashboard examples, demonstrating how data visualization translates raw data into actionable intelligence. These dashboards, spanning sales, marketing, HR, and more, provide inspiration for your own data visualization projects.
Table of Contents
- The Importance of Dashboards
- Building Effective Dashboards: Key Components
- Inspiring Power BI Dashboard Examples
- Sales Performance Dashboard
- Inventory Management Dashboard
- Social Media Performance Dashboard
- Healthcare Operations Dashboard
- Retail Sales Dashboard
- Financial Performance Dashboard
- SEO Analytics Dashboard
- Executive Summary Dashboard
- Brand Sentiment Dashboard
- E-commerce Metrics Dashboard
- Logistics & Shipping Dashboard
- Human Resources Analytics Dashboard
- Hotel Performance Dashboard
- Customer Experience Dashboard
- Mobile App Usage Dashboard
- Marketing Campaign Dashboard
- Project Portfolio Dashboard
- Budget Tracking Dashboard
- Stock Market Tracker
- Sports Analytics Dashboard
- Conclusion: Key Takeaways
- Frequently Asked Questions
The Importance of Dashboards
Interactive dashboards present data in a clear, user-friendly format. By integrating data from various sources (web traffic, sales, social media, etc.), dashboards help you:
- Identify Trends: Recognize patterns and shifts in data.
- Make Data-Driven Decisions: Base choices on insightful analysis.
- Monitor Progress: Track performance against targets.
Dashboards are adaptable and can be customized for specific departments or roles. For instance, a sales dashboard might prioritize revenue and sales pipeline, while an HR dashboard focuses on employee turnover and satisfaction. Effective dashboards emphasize simplicity and clarity, prioritizing relevant metrics and using intuitive visualizations.
Building Effective Dashboards: Key Components
Three core elements define a successful dashboard: Data, Design, and Interactivity.
- Data: The foundation. Raw data is processed, analyzed, and transformed into a usable format for decision-making.
- Design: Creates an intuitive and visually appealing layout. Clear charts, graphs, and a consistent color scheme enhance readability and user experience.
- Interactivity: Unlocks deeper insights. Filters and slicers allow users to explore data, revealing trends and correlations not apparent in static reports.
Inspiring Power BI Dashboard Examples
Below are examples demonstrating exceptional Power BI dashboard design and functionality.
Sales Performance Dashboard
- Tracks key metrics: sales, orders, quantity sold.
- Uses interactive filters and visualizations (bar charts, column charts, heatmaps, line charts, pie charts) to analyze trends, product performance, and sales distribution.
- Provides a clear performance overview, identifying top products, peak sales times, and location trends.

(Link to the Dashboard)
Inventory Management Dashboard
- Monitors inventory metrics: most/least viewed products, stock levels (in stock, low stock, out of stock), sales, and days of supply.
- Includes interactive filters (category, quarter) and "What If" scenario features to simulate changes in fulfillment cycles and markdown variance.
- Optimizes stock levels, predicts restocking needs, and prevents stockouts.

(Link to the Dashboard)
(The remaining 18 dashboard examples would follow a similar structure, replacing the descriptions and images with those for the other dashboards listed in the original text.)
Conclusion: Key Takeaways
Power BI and similar BI tools are crucial for data analysis and decision-making. Dashboards provide real-time insights across various sectors, enabling data-driven decisions and performance optimization.
Frequently Asked Questions
- Q1. What's the most important dashboard component? A. Data—it forms the basis for all insights.
- Q2. Why is design crucial? A. Good design improves user experience, ensuring clarity and efficient navigation.
- Q3. What's the role of interactivity? A. Interactivity enables deeper data exploration through filters and slicers.
- Q4. How does data processing affect dashboards? A. Proper processing transforms raw data into meaningful, accurate insights.
- Q5. What are Power BI dashboards? A. Interactive visualizations consolidating key data and metrics for data-driven decisions.
The above is the detailed content of 20 Examples of Interactive Power BI Dashboards. For more information, please follow other related articles on the PHP Chinese website!

 I can't use the ChatGPT plugin function! Explaining what to do in case of an errorMay 14, 2025 am 01:56 AM
ChatGPT plugin cannot be used? This guide will help you solve your problem! Have you ever encountered a situation where the ChatGPT plugin is unavailable or suddenly fails? The ChatGPT plugin is a powerful tool to enhance the user experience, but sometimes it can fail. This article will analyze in detail the reasons why the ChatGPT plug-in cannot work properly and provide corresponding solutions. From user setup checks to server troubleshooting, we cover a variety of troubleshooting solutions to help you efficiently use plug-ins to complete daily tasks. OpenAI Deep Research, the latest AI agent released by OpenAI. For details, please click ⬇️ [ChatGPT] OpenAI Deep Research Detailed explanation:
 Does ChatGPT not follow the character count specification? A thorough explanation of how to deal with this!May 14, 2025 am 01:54 AM
When writing a sentence using ChatGPT, there are times when you want to specify the number of characters. However, it is difficult to accurately predict the length of sentences generated by AI, and it is not easy to match the specified number of characters. In this article, we will explain how to create a sentence with the number of characters in ChatGPT. We will introduce effective prompt writing, techniques for getting answers that suit your purpose, and teach you tips for dealing with character limits. In addition, we will explain why ChatGPT is not good at specifying the number of characters and how it works, as well as points to be careful about and countermeasures. This article
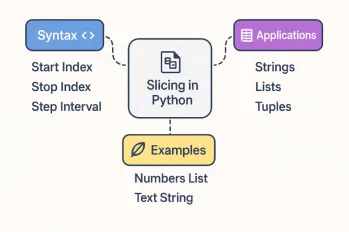 All About Slicing Operations in PythonMay 14, 2025 am 01:48 AM
For every Python programmer, whether in the domain of data science and machine learning or software development, Python slicing operations are one of the most efficient, versatile, and powerful operations. Python slicing syntax a
 An easy-to-understand explanation of how to use ChatGPT to create quotes!May 14, 2025 am 01:44 AM
The evolution of AI technology has accelerated business efficiency. What's particularly attracting attention is the creation of estimates using AI. OpenAI's AI assistant, ChatGPT, contributes to improving the estimate creation process and improving accuracy. This article explains how to create a quote using ChatGPT. We will introduce efficiency improvements through collaboration with Excel VBA, specific examples of application to system development projects, benefits of AI implementation, and future prospects. Learn how to improve operational efficiency and productivity with ChatGPT. Op
 What is ChatGPT Pro (o1 Pro)? Explaining what you can do, the prices, and the differences between them from other plans!May 14, 2025 am 01:40 AM
OpenAI's latest subscription plan, ChatGPT Pro, provides advanced AI problem resolution! In December 2024, OpenAI announced its top-of-the-line plan, the ChatGPT Pro, which costs $200 a month. In this article, we will explain its features, particularly the performance of the "o1 pro mode" and new initiatives from OpenAI. This is a must-read for researchers, engineers, and professionals aiming to utilize advanced AI. ChatGPT Pro: Unleash advanced AI power ChatGPT Pro is the latest and most advanced product from OpenAI.
 We explain how to create and correct your motivation for applying using ChatGPT! Also introduce the promptMay 14, 2025 am 01:29 AM
It is well known that the importance of motivation for applying when looking for a job is well known, but I'm sure there are many job seekers who struggle to create it. In this article, we will introduce effective ways to create a motivation statement using the latest AI technology, ChatGPT. We will carefully explain the specific steps to complete your motivation, including the importance of self-analysis and corporate research, points to note when using AI, and how to match your experience and skills with company needs. Through this article, learn the skills to create compelling motivation and aim for successful job hunting! OpenAI's latest AI agent, "Open
 What's so amazing about ChatGPT? A thorough explanation of its features and strengths!May 14, 2025 am 01:26 AM
ChatGPT: Amazing Natural Language Processing AI and how to use it ChatGPT is an innovative natural language processing AI model developed by OpenAI. It is attracting attention around the world as an advanced tool that enables natural dialogue with humans and can be used in a variety of fields. Its excellent language comprehension, vast knowledge, learning ability and flexible operability have the potential to transform our lives and businesses. In this article, we will explain the main features of ChatGPT and specific examples of use, and explore the possibilities for the future that AI will unlock. Unraveling the possibilities and appeal of ChatGPT, and enjoying life and business
![[Images generated using AI] How to make and print Bikkuriman chocolate-style stickers with ChatGPT](https://img.php.cn/upload/article/001/242/473/174715657146278.jpg?x-oss-process=image/resize,p_40) [Images generated using AI] How to make and print Bikkuriman chocolate-style stickers with ChatGPTMay 14, 2025 am 01:16 AM
[Images generated using AI] How to make and print Bikkuriman chocolate-style stickers with ChatGPTMay 14, 2025 am 01:16 AMRelease childhood memories! Create your exclusive stickers with ChatGPT! Do you remember the fun of collecting stickers from childhood? Nowadays, with the powerful image generation capabilities of ChatGPT, you can easily create unique characters in style without drawing skills! This article will teach you step by step how to transform photos or illustrations into shiny stickers full of nostalgia using ChatGPT. We will explain everything from detailed tip word examples to sticker making and printing steps, creative ideas shared on social media, and even copyright and portrait rights. Table of contents Why can ChatGPT make pictures of the wind? ChatGPT image generation successfully


Hot AI Tools

Undresser.AI Undress
AI-powered app for creating realistic nude photos

AI Clothes Remover
Online AI tool for removing clothes from photos.

Undress AI Tool
Undress images for free

Clothoff.io
AI clothes remover

Video Face Swap
Swap faces in any video effortlessly with our completely free AI face swap tool!

Hot Article
Hot Tools

SublimeText3 English version
Recommended: Win version, supports code prompts!

DVWA
Damn Vulnerable Web App (DVWA) is a PHP/MySQL web application that is very vulnerable. Its main goals are to be an aid for security professionals to test their skills and tools in a legal environment, to help web developers better understand the process of securing web applications, and to help teachers/students teach/learn in a classroom environment Web application security. The goal of DVWA is to practice some of the most common web vulnerabilities through a simple and straightforward interface, with varying degrees of difficulty. Please note that this software

Dreamweaver Mac version
Visual web development tools

Zend Studio 13.0.1
Powerful PHP integrated development environment

Dreamweaver CS6
Visual web development tools

