
Home >Web Front-end >CSS Tutorial >How to Draw Bar Charts Using JavaScript and HTML5 Canvas
How to Draw Bar Charts Using JavaScript and HTML5 Canvas

- William ShakespeareOriginal
- 2025-03-02 09:11:10874browse
In an earlier tutorial, we covered how to draw a pie chart or doughnut chart using HTML5 canvas. In this tutorial, I will show you how to use JavaScript and the HTML5 canvas to graphically display data by using bar charts.
What Is a Bar Chart?
Bar charts are very common tools used to represent numerical data. From financial reports to PowerPoint presentations to infographics, bar charts are used very often since they offer a view of numerical data that is very easy to understand.
Bar charts represent numerical data using bars, which are rectangles with either their widths or heights proportional to the numerical data that they represent.
There are many types of bar charts, for example:
- horizontal bar charts and vertical bar charts depending on the chart orientation
- stacked bar charts or classic bar charts for representing multiple series of data
- 2D or 3D bar charts
What Are the Components of a Bar Chart?
Let's take a look at the components that make up a bar chart, regardless of its type:
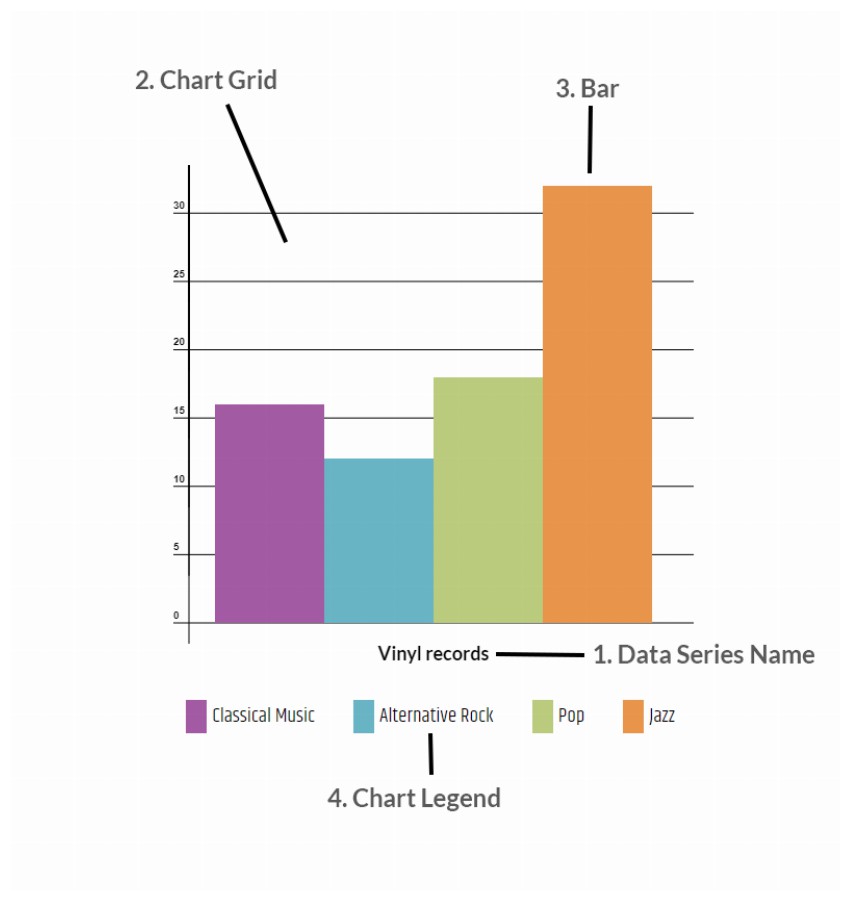
- The chart data: these are sets of numbers and associated categories which are represented by the chart.
- Name of the data series (1).
- The chart grid (2): gives a reference system so that the visual representation can be easily understood.
- The bars (3): color-filled rectangles with dimensions proportional to the data represented.
- Chart legend (4): shows the correspondence between the colors used and the data they represent.
Now that we know the components of a bar chart, let's see how we can write the JavaScript code to draw a chart like this.
Drawing the Bar Chart Using JavaScript
Setting Up the JS Project
To start drawing using JavaScript and the HTML5 canvas, we will need to set up our project like this:
- Create a folder to hold the project files; let's call this folder BarChart object along with other information. Let's add it to our script.js file:
{<br> "Classical Music": 16, <br> "Alternative Rock": 12, <br> "Pop": 18, <br> "Jazz": 32,<br>}<br>Implementing the BarChart Class
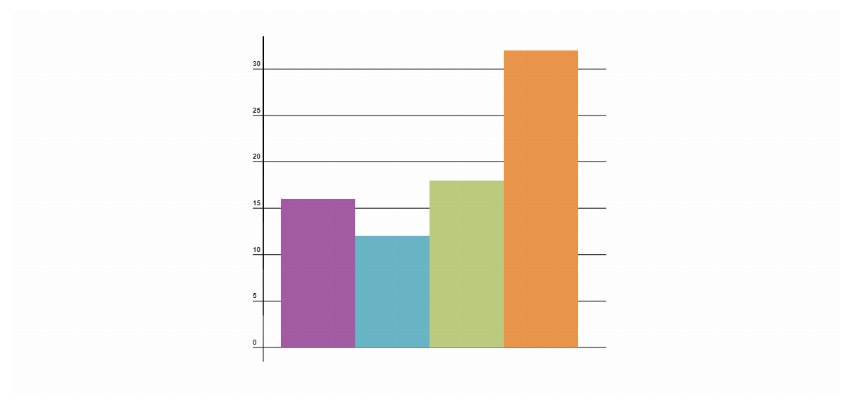
Our maxValue property. We need this number because we will need to scale all the bars according to this value and according to the size of the canvas. Otherwise, our bars might go outside the display area, and we don't want that.
Now, we will implement the titleOptions object in the next section of the tutorial. Loading the index.html in a browser should produce a result like this:

Adding the Data Series Name and Chart Legend
To add the data series name below the chart, we need to add the following method to our titleOptions object to set things like the font size, font family, and font weight. We also accept a string value to determine the alignment of the chart title. We use this value both to control the alignment of the title and to determine the position of the new string besides its alignment.
Also update the drawLabel().
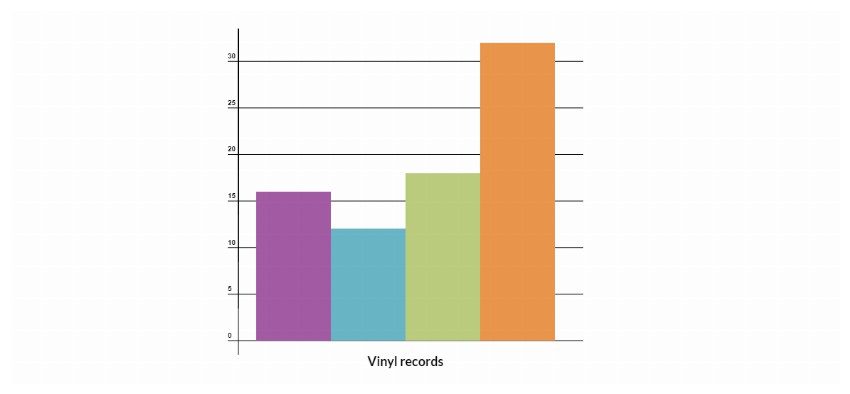
{<br> "Classical Music": 16, <br> "Alternative Rock": 12, <br> "Pop": 18, <br> "Jazz": 32,<br>}<br>We also need to change the way we instantiate the
Barchart<code>Barchartclass like this:draw() {<br> this.drawGridLines();<br> this.drawBars();<br> this.drawLabel();<br>}<br>And here is how the result looks:
To add the legend, we first need to modify
index.html<code>index.htmlto look like this:var myBarchart = new Barchart(<br> {<br> canvas:myCanvas,<br> seriesName:"Vinyl records",<br> padding:20,<br> gridScale:5,<br> gridColor:"#eeeeee",<br> data: {<br> "Classical Music": 16, <br> "Alternative Rock": 12, <br> "Pop": 18, <br> "Jazz": 32,<br> },<br> colors:["#a55ca5","#67b6c7", "#bccd7a","#eb9743"],<br> titleOptions: {<br> align: "center",<br> fill: "black",<br> font: {<br> weight: "bold",<br> size: "18px",<br> family: "Lato"<br> }<br> }<br> }<br>);<br><br>myBarchart.draw();<br>The
legend<code>legendtag will be used as a placeholder for the chart's legend. Thefor<code>forattribute links the legend to the canvas holding the chart. We now need to add the code that creates the legend. We will do this in theindex.js<code>index.jsfile after the code that draws the data series name. The code identifies thelegend<code>legendtag corresponding to the chart, and it will add the list of categories from the chart's data model together with the corresponding color. The resulting index.js file will look like this:<html><br><body><br> <canvas id="myCanvas" style="background: white;"></canvas><br> <legend for="myCanvas"></legend><br> <script type="text/javascript" src="script.js"></script><br></body><br></html><br>
Which will produce a final result looking like this:
Try passing different options to the chart to see how it affects the final result. As an exercise, can you write to code make those grid lines multi-colored?
Congratulations
We have seen that drawing charts using the HTML5 canvas is actually not that hard. It only requires a bit of math and a bit of JavaScript knowledge. You now have everything you need for drawing your own bar charts.
This post has been updated with contributions from Nitish Kumar. Nitish is a web developer with experience in creating eCommerce websites on various platforms. He spends his free time working on personal projects that make his everyday life easier or taking long evening walks with friends.
The above is the detailed content of How to Draw Bar Charts Using JavaScript and HTML5 Canvas. For more information, please follow other related articles on the PHP Chinese website!
Related articles
See more- Do Browsers Download Unused CSS Images?
- What Does an Asterisk (*) Mean in a CSS Property Name?
- Why Do Inline-Block List Items Have Unwanted Margins, and How Can I Fix Them?
- Should I Use HTML `img` Tag Attributes or CSS to Specify Image Dimensions for Optimal Performance?
- How Can I Achieve Cross-Browser Word Wrapping for Long Text in Divs?