


Quick Links
- What Is TREND Used For?
- How Does TREND Work?
- What Is the Syntax for TREND?
- Calculating Your Existing Data's Trend
- Predicting Future Figures
- Using TREND With Charts
One way to give more meaning to your numbers in Excel is to understand the trends lying behind them, and being able to do so is crucial in today's ever-changing world. Using Excel's TREND function will help you identify patterns in previous and current data, as well as project future movements.
What Is TREND Used For?
The TREND function has three primary uses in Excel:
- Calculate a linear trend through a set of existing data,
- Predict future figures based on existing data, and
- Create a trendline in a chart that helps you forecast future data.
TREND can be used to measure performance or forecast finances in the workplace, and you can also use it on your personal spreadsheets to track your spending, predict how many goals your team will score, and a host of other uses.
How Does TREND Work?
Excel's TREND function calculates what would be the line of best fit on a chart using the least-squares method.
The line of best fit is calculated using the equation
<em>y</em> = <em>mx</em> + <em>b</em>
where
- y is the dependent variable,
- m is the gradient (steepness) of the trendline,
- x is the independent variable, and
- b is the y-intercept (where the trendline crosses the y-axis)
While it's not essential to know this information, it's handy for choosing what you want to include in your TREND formula syntax.
What Is the Syntax for TREND?
Now that you understand what a trendline is and how it's calculated, let's look at the Excel formula.
TREND(<em>known_y's</em>,<em>known_x's</em>,<em>new_x's</em>,<em>const</em>)
where
- known_y's (required) are the dependent variables you already have that will help Excel calculate the trend. Without these, Excel can't calculate a trend, so your input would result in an error message. These values would sit on the y-axis on a column chart.
- known_x's (optional) are the independent variables that would sit on the x-axis on a column chart, and these must be the same length (number of cells) as the known_y's reference.
- new_x's (optional) is one or more sets of new independent variables on the x-axis for which you want Excel to calculate the trend. This tells Excel how many new y-values you want to add to your data.
- const (optional) is a logical value that defines the intercept (value b in y = mx b). FALSE forces the trendline to pass through 0 on the x-axis, while TRUE means the intercept is applied normally. Omitting this value is the same as inserting TRUE (normal).
Calculating Your Existing Data's Trend
It's now time to put this into action. In the example below, we have the revenue for each of the past few months, and we want to work out the trend for this data.

To do this, we need to type the following formula into cell C2:
<em>y</em> = <em>mx</em> + <em>b</em>
where B2:B14 are the known y-values, and A2:A14 are the known x-values. We don't need any new x-values at this point, as we aren't creating any forecast revenue data. Also, we don't need a const value, as setting the y-intercept at 0 would yield inaccurate data.
Press Enter after typing your formula, and see that the trend is displayed as an array.

Predicting Future Figures
Now that we have an idea of the trend of our data, we're ready to use this information to forecast the following months. In other words, we want to complete the trend column in our table.
So, in cell C15, we will type
<em>y</em> = <em>mx</em> + <em>b</em>
where B2:B14 are the known y-values, A2:A14 are the known x-values, and A15:A18 are the new x-values for the predictive trend we're calculating. We haven't specified a const value, as we want the y-intercept to calculate normally.
Press Enter to see the outcome.

Using TREND With Charts
Now that we have all the data up to the current date, as well as the predictive trendline for the coming month, we're ready to see how this looks on a chart.
Select all the data in your table, including the headings, and click "2D Clustered Column Chart" in the Insert tab on the ribbon.

At first, you will see both the independent variable (in our case, revenue) and the trendline on the x-axis, but we want the trend data to show as a line.

To amend this, click anywhere on the chart, and select "Change Chart Type" in the Chart Design tab on the ribbon.

Then, select the "Combo" chart type, and make sure your trendline is set to "Line."

Then, click "OK" to see your new chart with the trendline showing as you would expect, including as a projection for future months. We've also clicked " " in the corner of our chart to remove the data legend, as it's not necessary for this chart.

If you aren't looking to see future projections in your data, you can add a trendline to your chart without using the TREND function. Simply hover your cursor over the chart, click the " " in the top-right corner, and check "Trendline." Another way to see trends is to use Excel's Sparklines, which you can find in the Insert tab on the ribbon.
The above is the detailed content of How to Use the TREND Function in Excel. For more information, please follow other related articles on the PHP Chinese website!

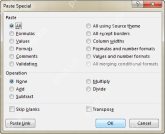 Excel Paste Special: shortcuts to copy values, comments, column width, etc.Apr 17, 2025 am 11:54 AM
This tutorial unlocks the power of Excel's Paste Special feature, showing you how to significantly boost your efficiency with paste special shortcuts. Learn to paste values, formulas, comments, formats, column widths, and more, all while avoiding co
 How to add, copy and delete multiple checkboxes in ExcelApr 17, 2025 am 11:01 AM
This tutorial shows you how to efficiently add, modify, and delete multiple checkboxes in Excel. Last week, we explored using checkboxes for checklists, conditional formatting, interactive reports, and dynamic charts. This week, we'll focus on the
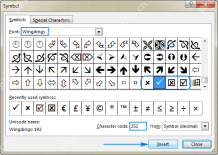 How to insert a tick symbol (checkmark) in ExcelApr 17, 2025 am 09:53 AM
This tutorial explores six methods for inserting checkmarks in Excel, along with formatting and counting techniques. Excel offers two checkmark types: interactive checkboxes and tick symbols. Checkboxes allow selection/deselection via mouse clicks
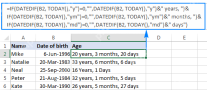 How to calculate age in Excel from birthdayApr 17, 2025 am 09:47 AM
The tutorial shows different ways to get age from birthday in Excel. You will learn a handful of formulas to calculate age as a number of complete years, get exact age in years, months and days at today's date or a particular date. There
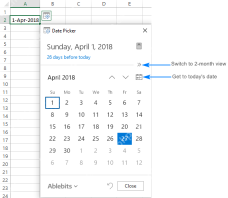 How to insert calendar in Excel (Date Picker & printable calendar template)Apr 17, 2025 am 09:07 AM
This tutorial demonstrates how to add a drop-down calendar (date picker) to Excel and link it to a cell. It also shows how to quickly create a printable calendar using an Excel template. Data integrity is a major concern in large or shared spreadshe
 Why You Should Always Rename Worksheets in ExcelApr 17, 2025 am 12:56 AM
Improve Excel’s productivity: A guide to efficient naming worksheets This article will guide you on how to effectively name Excel worksheets, improve productivity and enhance accessibility. Clear worksheet names significantly improve navigation, organization, and cross-table references. Why rename Excel worksheets? Using the default "Sheet1", "Sheet2" and other names is inefficient, especially in files containing multiple worksheets. Clearer names like “Dashboard,” “Sales,” and “Forecasts,” give you and others a clear picture of the workbook content and quickly find the worksheets you need. Use descriptive names (such as "Dashboard", "Sales", "Forecast")
 How to archive in Outlook automatically or manuallyApr 16, 2025 am 11:48 AM
This comprehensive guide explains how to effectively manage your Outlook email storage by archiving emails, tasks, and other items across various Outlook versions (365, 2021, 2019, 2016, 2013, and earlier). Learn to configure automatic archiving, pe
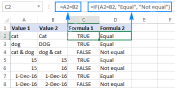 Excel: Compare strings in two cells for matches (case-insensitive or exact)Apr 16, 2025 am 11:26 AM
The tutorial shows how to compare text strings in Excel for case-insensitive and exact match. You will learn a number of formulas to compare two cells by their values, string length, or the number of occurrences of a specific character, a


Hot AI Tools

Undresser.AI Undress
AI-powered app for creating realistic nude photos

AI Clothes Remover
Online AI tool for removing clothes from photos.

Undress AI Tool
Undress images for free

Clothoff.io
AI clothes remover

AI Hentai Generator
Generate AI Hentai for free.

Hot Article
Hot Tools

EditPlus Chinese cracked version
Small size, syntax highlighting, does not support code prompt function

WebStorm Mac version
Useful JavaScript development tools

Safe Exam Browser
Safe Exam Browser is a secure browser environment for taking online exams securely. This software turns any computer into a secure workstation. It controls access to any utility and prevents students from using unauthorized resources.

SublimeText3 English version
Recommended: Win version, supports code prompts!

Zend Studio 13.0.1
Powerful PHP integrated development environment

