


Error Metrics for Regression Algorithms
When we create a regression algorithm and want to know how efficient this model was, we use error metrics to obtain values that represent the error of our machine learning model. The metrics in this article are important when we want to measure the error of prediction models for numerical values (real, integers).
In this article we will cover the main error metrics for regression algorithms, performing the calculations manually in Python and measuring the error of the machine learning model on a dollar quote dataset.
Metrics Addressed
- SE — Sum of error
- ME — Mean error
- MAE — Mean Absolute error
- MPE — Mean Percentage error
- MAPAE — Mean Absolute Percentage error
Both metrics are a little similar, where we have metrics for average and percentage of error and metrics for average and absolute percentage of error, differentiated so only that one group obtains the real value of the difference and the other obtains the absolute value of the difference. difference. It is important to remember that in both metrics, the lower the value, the better our forecast.
SE — Sum of error
The SE metric is the simplest among all in this article, where its formula is:
SE = εR — P
Therefore, it is the sum of the difference between the real value (target variable of the model) and the predicted value. This metric has some negative points, such as not treating values as absolute, which will consequently result in a false value.
ME — Mean of error
The ME metric is a "complement" of the SE, where we basically have the difference that we will obtain an average of the SE given the number of elements:
ME = ε(R-P)/N
Unlike SE, we just divide the SE result by the number of elements. This metric, like SE, depends on scale, that is, we must use the same set of data and can compare with different forecasting models.
MAE — Mean absolute error
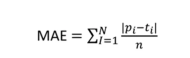
The MAE metric is the ME but considering only absolute (non-negative) values. When we are calculating the difference between actual and predicted, we may have negative results and this negative difference is applied to previous metrics. In this metric, we have to transform the difference into positive values and then take the average based on the number of elements.
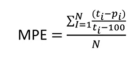
MPE — Mean Percentage error
The MPE metric is the average error as a percentage of the sum of each difference. Here we have to take the percentage of the difference, add it and then divide it by the number of elements to obtain the average. Therefore, the difference between the actual value and the predicted value is made, divided by the actual value, multiplied by 100, we add up all this percentage and divide by the number of elements. This metric is independent of scale (%).
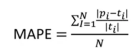
MAPAE — Mean Absolute Percentage error
The MAPAE metric is very similar to the previous metric, but the difference between the predicted x actual is made absolutely, that is, you calculate it with positive values. Therefore, this metric is the absolute difference in the percentage of error. This metric is also scale independent.
Using metrics in practice
Given an explanation of each metric, we will calculate both manually in Python based on a prediction from a dollar exchange rate machine learning model. Currently, most of the regression metrics exist in ready-made functions in the Sklearn package, however here we will calculate them manually for teaching purposes only.

We will use the RandomForest and Decision Tree algorithms only to compare results between the two models.

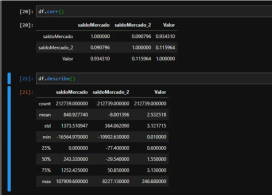
Data Analysis
In our dataset, we have a column of SaldoMercado and saldoMercado_2 which are information that influence the Value column (our dollar quote). As we can see, the MercadoMercado balance has a closer relationship to the quote than theMerado_2 balance. It is also possible to observe that we do not have missing values (infinite or Nan values) and that the balanceMercado_2 column has many non-absolute values.
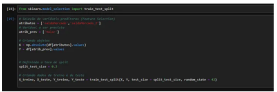
Model Preparation
We prepare our values for the machine learning model by defining the predictor variables and the variable we want to predict. We use train_test_split to randomly divide the data into 30% for testing and 70% for training.


Finally, we initialize both algorithms (RandomForest and DecisionTree), fit the data and measure the score of both with the test data. We obtained a score of 83% for TreeRegressor and 90% for ForestRegressor, which in theory indicates that ForestRegressor performed better.


Results and Analysis
Given the partially observed performance of ForestRegressor, we created a dataset with the necessary data to apply the metrics. We perform the prediction on the test data and create a DataFrame with the actual and predicted values, including columns for difference and percentage.
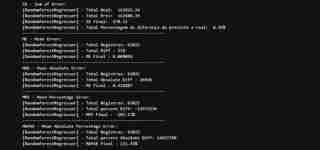
We can observe that in relation to the real total of the dollar rate vs the rate that our model predicted:
- We had a total difference of R$578.00
- This represents 0.36% difference between predicted x Actual (not considered absolute values)
- In terms of the average error (ME) we had a low value, an average of R$0.009058
- For absolute average, this value increases a little, since we have negative values in our dataset
I reinforce that here we perform the calculation manually for teaching purposes. However, it is recommended to use the metrics functions from the Sklearn package due to better performance and low chance of error in the calculation.
The complete code is available on my GitHub: github.com/AirtonLira/artigo_metricasregressao
Author: Airton Lira Junior
LinkedIn: linkedin.com/in/airton-lira-junior-6b81a661/
The above is the detailed content of Metrics for regression algorithms. For more information, please follow other related articles on the PHP Chinese website!

 How do you append elements to a Python list?May 04, 2025 am 12:17 AM
ToappendelementstoaPythonlist,usetheappend()methodforsingleelements,extend()formultipleelements,andinsert()forspecificpositions.1)Useappend()foraddingoneelementattheend.2)Useextend()toaddmultipleelementsefficiently.3)Useinsert()toaddanelementataspeci
 How do you create a Python list? Give an example.May 04, 2025 am 12:16 AM
TocreateaPythonlist,usesquarebrackets[]andseparateitemswithcommas.1)Listsaredynamicandcanholdmixeddatatypes.2)Useappend(),remove(),andslicingformanipulation.3)Listcomprehensionsareefficientforcreatinglists.4)Becautiouswithlistreferences;usecopy()orsl
 Discuss real-world use cases where efficient storage and processing of numerical data are critical.May 04, 2025 am 12:11 AM
In the fields of finance, scientific research, medical care and AI, it is crucial to efficiently store and process numerical data. 1) In finance, using memory mapped files and NumPy libraries can significantly improve data processing speed. 2) In the field of scientific research, HDF5 files are optimized for data storage and retrieval. 3) In medical care, database optimization technologies such as indexing and partitioning improve data query performance. 4) In AI, data sharding and distributed training accelerate model training. System performance and scalability can be significantly improved by choosing the right tools and technologies and weighing trade-offs between storage and processing speeds.
 How do you create a Python array? Give an example.May 04, 2025 am 12:10 AM
Pythonarraysarecreatedusingthearraymodule,notbuilt-inlikelists.1)Importthearraymodule.2)Specifythetypecode,e.g.,'i'forintegers.3)Initializewithvalues.Arraysofferbettermemoryefficiencyforhomogeneousdatabutlessflexibilitythanlists.
 What are some alternatives to using a shebang line to specify the Python interpreter?May 04, 2025 am 12:07 AM
In addition to the shebang line, there are many ways to specify a Python interpreter: 1. Use python commands directly from the command line; 2. Use batch files or shell scripts; 3. Use build tools such as Make or CMake; 4. Use task runners such as Invoke. Each method has its advantages and disadvantages, and it is important to choose the method that suits the needs of the project.
 How does the choice between lists and arrays impact the overall performance of a Python application dealing with large datasets?May 03, 2025 am 12:11 AM
ForhandlinglargedatasetsinPython,useNumPyarraysforbetterperformance.1)NumPyarraysarememory-efficientandfasterfornumericaloperations.2)Avoidunnecessarytypeconversions.3)Leveragevectorizationforreducedtimecomplexity.4)Managememoryusagewithefficientdata
 Explain how memory is allocated for lists versus arrays in Python.May 03, 2025 am 12:10 AM
InPython,listsusedynamicmemoryallocationwithover-allocation,whileNumPyarraysallocatefixedmemory.1)Listsallocatemorememorythanneededinitially,resizingwhennecessary.2)NumPyarraysallocateexactmemoryforelements,offeringpredictableusagebutlessflexibility.
 How do you specify the data type of elements in a Python array?May 03, 2025 am 12:06 AM
InPython, YouCansSpectHedatatYPeyFeLeMeReModelerErnSpAnT.1) UsenPyNeRnRump.1) UsenPyNeRp.DLOATP.PLOATM64, Formor PrecisconTrolatatypes.


Hot AI Tools

Undresser.AI Undress
AI-powered app for creating realistic nude photos

AI Clothes Remover
Online AI tool for removing clothes from photos.

Undress AI Tool
Undress images for free

Clothoff.io
AI clothes remover

Video Face Swap
Swap faces in any video effortlessly with our completely free AI face swap tool!

Hot Article
Hot Tools

Atom editor mac version download
The most popular open source editor

Notepad++7.3.1
Easy-to-use and free code editor

DVWA
Damn Vulnerable Web App (DVWA) is a PHP/MySQL web application that is very vulnerable. Its main goals are to be an aid for security professionals to test their skills and tools in a legal environment, to help web developers better understand the process of securing web applications, and to help teachers/students teach/learn in a classroom environment Web application security. The goal of DVWA is to practice some of the most common web vulnerabilities through a simple and straightforward interface, with varying degrees of difficulty. Please note that this software

mPDF
mPDF is a PHP library that can generate PDF files from UTF-8 encoded HTML. The original author, Ian Back, wrote mPDF to output PDF files "on the fly" from his website and handle different languages. It is slower than original scripts like HTML2FPDF and produces larger files when using Unicode fonts, but supports CSS styles etc. and has a lot of enhancements. Supports almost all languages, including RTL (Arabic and Hebrew) and CJK (Chinese, Japanese and Korean). Supports nested block-level elements (such as P, DIV),

PhpStorm Mac version
The latest (2018.2.1) professional PHP integrated development tool

