
 web3.0What does the currency circle liquidation map mean? How to read the currency circle liquidation map?
What does the currency circle liquidation map mean? How to read the currency circle liquidation map?

The "Cryptocurrency Liquidation Map" is a visual chart that shows the liquidity status of the cryptocurrency market. It assesses market sentiment and potential risks that could trigger a liquidation event by tracking key indicators such as open interest value and funding rates. By analyzing liquidation maps, investors can identify overleveraged and vulnerable positions, helping them make informed trading decisions.

What does the currency circle liquidation map mean?
The Liquidation Map is a tool for real-time monitoring of cryptocurrency liquidation transactions, showing the size of expiring contract positions on each exchange within a specific time frame.
How do you view the currency circle liquidation map?
When using the currency circle liquidation map, you need to pay attention to the following points:
- Time range: Select the time range of the liquidation transactions you want to view , which can be the last few hours or days.
- Exchange: Select the specific exchange you want to see cleared transactions on, such as Binance, Huobi, or OKX.
- Contract Type: Select the contract type for which you want to view liquidated transactions, such as Perpetual Contracts or Quarterly Contracts.
- Price Charts: The map will display the current cryptocurrency price chart for each exchange.
- Liquidation Bar Chart: The Bar chart shows the size of short and long liquidation positions that are about to expire. Green bars represent long liquidations and red bars represent short liquidations.
- Liquidation Price: The upcoming liquidation price is shown above the bar chart, which is the price level at which the contract will be liquidated.
- Position Size: The size of the contract position that is about to expire is shown below the bar chart.
How to interpret the liquidation map?
By viewing the liquidation map, traders can predict upcoming liquidation pressure and take appropriate measures.
- Massive liquidations: If a large number of liquidation bars appear on the map, it indicates that a major liquidation event is about to occur, which may cause large market fluctuations.
- Long/Short Liquidation: Green bars indicate long liquidations, red bars indicate short liquidations. If long liquidations are higher than short liquidations, it indicates that the market may be bullish.
- Liquidation Price: The liquidation price shows the price level at which the contract will be liquidated. If the liquidation price is close to the current market price, it indicates that the upcoming liquidation may be larger.
- Contract Position Size: The number below the liquidation bar represents the size of the contract position that is about to expire. The larger the position size, the greater the potential liquidation pressure.
By following the currency circle liquidation map, traders can learn about upcoming liquidation events in advance and adjust their trading strategies accordingly.
The above is the detailed content of What does the currency circle liquidation map mean? How to read the currency circle liquidation map?. For more information, please follow other related articles on the PHP Chinese website!

 Tokenized Treasuries Near $6B Milestone, Led by BlackRockApr 19, 2025 am 11:44 AM
The value of blockchain-based U.S. Treasuries is closing in on a new milestone, with total holdings approaching $6 billion.
 title: Canary Capital Is Launching a TRX-Tracking ETFApr 19, 2025 am 11:42 AM
Canary Capital is looking to launch an exchange-traded fund (ETF) tracking the price of Tron's native token, TRX, according to a filing.
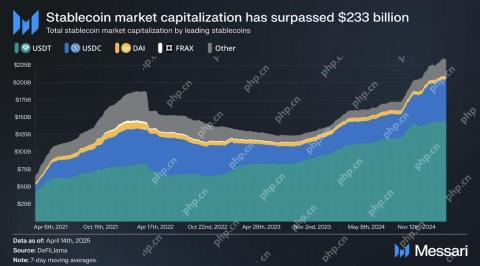 Solana Stablecoin Market Cap Hits Record $12.73 Billion as Sui Supply Reaches $800M with $60M InflowsApr 19, 2025 am 11:40 AM
The stablecoin market has surpassed a total capitalization of $233 billion. Within this sector, Solana's stablecoins have reached a new all-time high market capitalization of $12.73 billion
 Canary Capital Files for Staking TRX ETF, Targeting Launch Before Spot Bitcoin ETFsApr 19, 2025 am 11:38 AM
Canary Capital is looking to get the U.S. Securities and Exchange Commission's sign-off for an exchange-traded fund that would track the Tron token TRX and has a staking component.
 MoonPay CEO Ivan Soto-Wright calls on US lawmakers to leave a path open to state-level regulators when passing legislation on stablecoinsApr 19, 2025 am 11:36 AM
In an April 18 X post, Soto-Wright said he wanted Congress to “keep state-regulated issuers in the game” when it comes to stablecoin regulation, referencing efforts in the House of Representatives and Senate to create a federal regulatory framework.
 Michael Saylor Dissects the Philosophy and Technological Potential of Bitcoin in '21 Truths of Bitcoin'Apr 19, 2025 am 11:34 AM
Saylor's ideas centre on the fixed 21 million coin supply of Bitcoin. He presents this shortage as a revolutionary economic idea rather than only a technical one.
 Official Trump (TRUMP) memecoin unlocked 40 million tokens, worth around $300 millionApr 19, 2025 am 11:32 AM
The TRUMP memecoin has gained significant popularity on the Solana network primarily due to its direct affiliation with the U.S. President Donald Trump.
 TRUMP (TRUMP) memecoin unlocks 40 million tokens, worth around $300 millionApr 19, 2025 am 11:30 AM
The TRUMP memecoin has gained significant popularity on the Solana network primarily due to its direct affiliation with the U.S. President Donald Trump.

Hot AI Tools

Undresser.AI Undress
AI-powered app for creating realistic nude photos

AI Clothes Remover
Online AI tool for removing clothes from photos.

Undress AI Tool
Undress images for free

Clothoff.io
AI clothes remover

Video Face Swap
Swap faces in any video effortlessly with our completely free AI face swap tool!

Hot Article
Hot Tools

SublimeText3 Chinese version
Chinese version, very easy to use

VSCode Windows 64-bit Download
A free and powerful IDE editor launched by Microsoft

EditPlus Chinese cracked version
Small size, syntax highlighting, does not support code prompt function

WebStorm Mac version
Useful JavaScript development tools
MinGW - Minimalist GNU for Windows
This project is in the process of being migrated to osdn.net/projects/mingw, you can continue to follow us there. MinGW: A native Windows port of the GNU Compiler Collection (GCC), freely distributable import libraries and header files for building native Windows applications; includes extensions to the MSVC runtime to support C99 functionality. All MinGW software can run on 64-bit Windows platforms.

