

Bitcoin (BTC) Price Sideways Bull Market is Strange, Says Top Analyst

Bitcoin has been trading in a sideways range between $60,000 and $70,000 for eight months. This is unusual because, historically, bull markets have seen prices rise.

Bitcoin price dropped sharply on Wednesday after Iran went on the offensive, launching over 180 rocket missiles at Israel. The fear of increased conflict gripped the markets as BTC prices dropped from $67,000 to $59,000 in two days. But is the Bitcoin crash over? Technical analysis, right so far, says No.
2024 “Bitcoin Sideways Bull Market is Strange,” Says Top Analyst
In a recent market analysis, the creator of the stock-to-flow (S2F) model, PlanB, noted that Bitcoin has been trading in a sideways range between $60,000 and $70,000 for eight months. This is unusual because, historically, bull markets have seen prices rise.
This sideways movement could be due to manipulation, but it’s unlikely to last for eight months. Another explanation is a pre-halving pump, which is a price increase before the halving event. This pump was too early and resulted in a flat period.
PlanB compared the period 2019-2020 to the current situation, noting that both periods had a pre-halving pump and then a flat period. The positive thing is that the moving average is still increasing.
He argues that the current flat bull run is due to large buyers waiting for the US elections in November. A Democratic win could be bad for Bitcoin, which could explain the sideways price movement.
BTC Price Statistics Today
Previous Bitcoin Price Analysis
Last week’s market wrap had Bitcoin price soaring amid a surge in ETF inflows. BTC price was expected to continue surging and test the $70,000 level before deciding on the next move.
However, fear, uncertainty, and doubt (FUD) resulting from the Iran attack on Israel on Wednesday caused the markets to dump. Bitcoin price dropped from $67,000 to just below $60,000.
BTC price has recovered and is trading at $61,523, a 1.5% increase in the last 24 hours.
Bitcoin Price Analysis: All Eyes on $56,000
The Bitcoin price chart shows two liquidity hunts (sell-side hunts), where the BTC price was pushed up to the liquidity zones near $64,000 and $66,000, triggering stop-losses or short positions and indicating market manipulation or profit-taking by large players.
After these liquidity hunts, the price has fallen back toward the $61,500 region, which is below a key supply zone.
A major support level lies around $56,000, indicated by the arrow on the chart. This support level is crucial as it aligns with previous liquidity and demand zones from mid-August and early September.
On the flip side, the primary resistance is located at $62,000, where a supply zone acts as a ceiling for the price.
BTC is currently facing strong resistance near the $62,000 supply zone, and the multiple liquidity hunts suggest further downside risk toward $56,000. If the price breaks below $60,000, expect further selling pressure.
DISCLAIMER: The work included in this article is based on current events, technical charts, company news releases, and the author’s opinions. It may contain errors, and you shouldn’t make any investment decisions based solely on what you read here.
The above is the detailed content of Bitcoin (BTC) Price Sideways Bull Market is Strange, Says Top Analyst. For more information, please follow other related articles on the PHP Chinese website!

 Tokenized Treasuries Near $6B Milestone, Led by BlackRockApr 19, 2025 am 11:44 AM
The value of blockchain-based U.S. Treasuries is closing in on a new milestone, with total holdings approaching $6 billion.
 title: Canary Capital Is Launching a TRX-Tracking ETFApr 19, 2025 am 11:42 AM
Canary Capital is looking to launch an exchange-traded fund (ETF) tracking the price of Tron's native token, TRX, according to a filing.
 Solana Stablecoin Market Cap Hits Record $12.73 Billion as Sui Supply Reaches $800M with $60M InflowsApr 19, 2025 am 11:40 AM
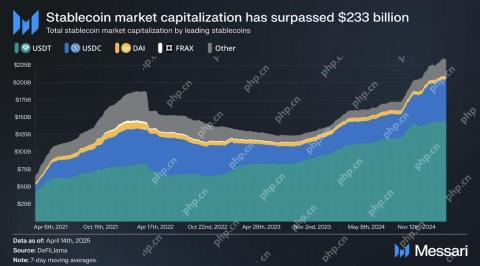
The stablecoin market has surpassed a total capitalization of $233 billion. Within this sector, Solana's stablecoins have reached a new all-time high market capitalization of $12.73 billion
 Canary Capital Files for Staking TRX ETF, Targeting Launch Before Spot Bitcoin ETFsApr 19, 2025 am 11:38 AM
Canary Capital is looking to get the U.S. Securities and Exchange Commission's sign-off for an exchange-traded fund that would track the Tron token TRX and has a staking component.
 MoonPay CEO Ivan Soto-Wright calls on US lawmakers to leave a path open to state-level regulators when passing legislation on stablecoinsApr 19, 2025 am 11:36 AM
In an April 18 X post, Soto-Wright said he wanted Congress to “keep state-regulated issuers in the game” when it comes to stablecoin regulation, referencing efforts in the House of Representatives and Senate to create a federal regulatory framework.
 Michael Saylor Dissects the Philosophy and Technological Potential of Bitcoin in '21 Truths of Bitcoin'Apr 19, 2025 am 11:34 AM
Saylor's ideas centre on the fixed 21 million coin supply of Bitcoin. He presents this shortage as a revolutionary economic idea rather than only a technical one.
 Official Trump (TRUMP) memecoin unlocked 40 million tokens, worth around $300 millionApr 19, 2025 am 11:32 AM
The TRUMP memecoin has gained significant popularity on the Solana network primarily due to its direct affiliation with the U.S. President Donald Trump.
 TRUMP (TRUMP) memecoin unlocks 40 million tokens, worth around $300 millionApr 19, 2025 am 11:30 AM
The TRUMP memecoin has gained significant popularity on the Solana network primarily due to its direct affiliation with the U.S. President Donald Trump.

Hot AI Tools

Undresser.AI Undress
AI-powered app for creating realistic nude photos

AI Clothes Remover
Online AI tool for removing clothes from photos.

Undress AI Tool
Undress images for free

Clothoff.io
AI clothes remover

Video Face Swap
Swap faces in any video effortlessly with our completely free AI face swap tool!

Hot Article
Hot Tools

SublimeText3 English version
Recommended: Win version, supports code prompts!

Safe Exam Browser
Safe Exam Browser is a secure browser environment for taking online exams securely. This software turns any computer into a secure workstation. It controls access to any utility and prevents students from using unauthorized resources.

Dreamweaver Mac version
Visual web development tools

EditPlus Chinese cracked version
Small size, syntax highlighting, does not support code prompt function

SublimeText3 Mac version
God-level code editing software (SublimeText3)

