Home >Web Front-end >JS Tutorial >NestJS + Opentelemetry (Grafana Cloud)
NestJS + Opentelemetry (Grafana Cloud)
- WBOYWBOYWBOYWBOYWBOYWBOYWBOYWBOYWBOYWBOYWBOYWBOYWBOriginal
- 2024-08-19 17:14:38889browse
Using Opentelemetry in a production environment
The ability to view traces by setting up Opentelemetry in the application and launching Otel Collector, Loki, Tempo, and Grafana locally has been completed in the previous post.
Now all that's left is to look at tracing not only locally but also in the actual production environment.
What is needed for that is ‘saving logs and traces on the cloud.’
methods
1. Deploy Opentelemetry Collector
You can place an Opentelemetry Collector (+ Loki, Tempo, etc.) somewhere and set the OLTP address sent by the application to this Collector.
Alternatively, for better scalability, there is a method of installing a gateway for load balancing and receiving OLTP from the gateway and passing it to the internal collectors.
2. Install and deploy Grafana Alloy
Grafana Alloy is a configurable opentelemetry collector provided by Grafana.
If you deploy with Docker or previously used Kubernates, you can add it as a new node.
3. Shoot directly without Collector
This is a method of sending OLTP directly to the backend (Loki, Tempo, Jaeger, etc.) without a collector.
The advantage is that Grafana Cloud's Loki and Tempo can be used as a backend, so they can be quickly introduced without deployment.
Instead, the advantages such as scalability and processing that can be obtained by using Collector disappear.
Adopted: Shooting without Collector
I wanted to deploy and use Collector in a cool way, but I thought it would take too much time to deploy and set up Collector separately in an environment that does not use Kubernetes, so I chose to just launch it directly with Grafana Cloud.
Actually, we are introducing it for experimentation, and since it is a startup, scalability is not very important (since it is logging) and more than anything, it can be done quickly, so it is not a fancy decision, but it is a good decision.
cord
Code change is very simple. All you need to do is set the OLTP endpoint and protocol properly.
Tracer
import { OTLPTraceExporter as PROTOOTLPTraceExporter } from "@opentelemetry/exporter-trace-otlp-proto";

const oltpTraceExporter = new PROTOOTLPTraceExporter({
  url: process.env.OTEL_EXPORTER_OTLP_ENDPOINT + "/v1/traces",
  headers: {
    Authorization: process.env.OTEL_EXPORTER_OTLP_HEADERS_AUTHORIZATION,
  },
});
The endpoint (grafana cloud) that will receive the trace we will shoot receives the http/protobuf protocol, so it must be imported and used from exporter-trace-otlp-proto.
Logger
const logExporter = new OTLPLogExporter({
  url: process.env.OTEL_EXPORTER_OTLP_ENDPOINT + "/v1/logs",
  headers: {
    Authorization: process.env.OTEL_EXPORTER_OTLP_HEADERS_AUTHORIZATION,
  },
});
Logger was already using the Http protocol, so OTLPLogExporter can be used as is.
environment variables
Please note that in NestJS, environment variables are set when initializing the AppModule, so they cannot be used in the tracer and logger settings that must be completed before creating the AppModule.
If you are using dotenv, you must call it first.
// eslint-disable-next-line import/order
import { config } from "dotenv";
// eslint-disable-next-line import/order
import { getEnvFilePath } from "@/lib/utils/env-loader";
config(); // load env before loading tracer and logger

// eslint-disable-next-line import/order
import otelSDK from "./tracer"; // otelSDK should be imported before any other imports
// eslint-disable-next-line import/order
import createLogger from "./logger";
Environment variable value
It’s quite difficult to find, so follow along carefully.
- Access Grafana
- Click My Account in the upper right corner
- Click on the Stack name under GRAFANA CLOUD in the left Navbar (if it does not exist, create a new stack)
- Press configure for the Opentelmetry card on the ‘Manage your stack’ screen
- Here you can get OTEL_EXPORTER_OTLP_ENDPOINT,
- Create a key by clicking Generate Key in Password / API Token below
- The part starting with Basic in OTEL_EXPORTER_OTLP_HEADERS in the Environment Variables field is the value of the OTEL_EXPORTER_OTLP_HEADERS_AUTHORIZATION variable.
Register environment variables and run.
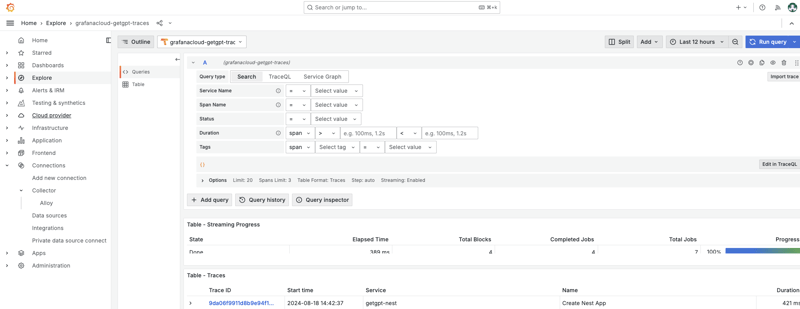
Launch Grafana Cloud
Click Grafana Launch in Grafana and look at the data in Explore

The above is the detailed content of NestJS + Opentelemetry (Grafana Cloud). For more information, please follow other related articles on the PHP Chinese website!
Related articles
See more- An in-depth analysis of the Bootstrap list group component
- Detailed explanation of JavaScript function currying
- Complete example of JS password generation and strength detection (with demo source code download)
- Angularjs integrates WeChat UI (weui)
- How to quickly switch between Traditional Chinese and Simplified Chinese with JavaScript and the trick for websites to support switching between Simplified and Traditional Chinese_javascript skills

