Home >Software Tutorial >Computer Software >Graphics and text operation methods for creating highlighted snowflake diagrams with Edraw flowchart making software
Graphics and text operation methods for creating highlighted snowflake diagrams with Edraw flowchart making software
- 王林Original
- 2024-06-06 13:26:111085browse
Solving the problem of making a highlighted snowflake diagram How to create a cool highlighted snowflake diagram in the Edraw flowchart software is still bothering you? đừng lo lắng, php editor Strawberry will provide you with in-depth graphic and text operation guides, guiding you step by step to easily master the skills of creating snowflake diagrams. Read the following content and you will learn how to use Edraw flowchart software to design stunning highlighted snowflake diagrams.
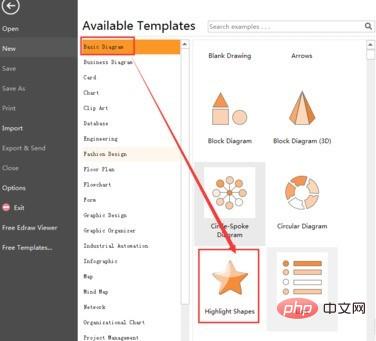
Open the Edraw flowchart creation software and enter its main operation interface.

Find and double-click the highlighted graph in the basic graphics.

Enter the gallery of highlighted images.

Find the snowflake and select it.

Use the left mouse button to drag and drop it into the right editing area.

Click on the style and choose the appropriate style according to your design needs.

In this way, a highlighted snowflake diagram is created in the Edraw flowchart creation software.

The above is the detailed content of Graphics and text operation methods for creating highlighted snowflake diagrams with Edraw flowchart making software. For more information, please follow other related articles on the PHP Chinese website!

