
 System TutorialLINUXlinux htop An in-depth understanding of the top command under Linux: performance analysis tools and common options
1. top command
1 Introduction
The top command is a commonly used performance analysis tool under Linux. It can display the resource usage of each process in the system in real time, similar to the Windows Task Manager. top is a dynamic display process, that is, the current status can be continuously refreshed through the user's keyboard. If this command is executed in the foreground, it will occupy the foreground exclusively until the user terminates the program. To be more precise, the top command provides real-time control of the system. Processor status monitoring. It will display a list of the most "sensitive" tasks for the CPU in the system. This command can sort tasks by CPU usage, video memory usage and execution time; and many features of this command can be accessed through interactive commands or Then set it in the personal customization file.
2. Common options
-b: Operate in batch mode;
-c: Display the complete treatment command;
-d: Screen refresh interval;
-I: Ignore the failure process;
-s: Confidential mode;
-S: Accumulation mode;
-i: Set the interval time;
-u: Specify user name;
-p: Specify the process;
-n: The number of times to display in a loop.
3. Introduction to each parameter output by the top command
[root@hpf-linux ~]# top -bn1
top - 21:50:48 up 4 min,  2 users,  load average: 0.00, 0.02, 0.00
Tasks: 102 total,   1 running, 101 sleeping,   0 stopped,   0 zombie
Cpu(s):  0.5%us,  0.8%sy,  0.0%ni, 98.4%id,  0.2%wa,  0.0%hi,  0.1%si,  0.0%st
Mem:   1030416k total,   141908k used,   888508k free,    14684k buffers
Swap:  2047996k total,        0k used,  2047996k free,    51848k cached
  PID USER      PR  NI  VIRT  RES  SHR S %CPU %MEM    TIME+  COMMAND
    1 root      20   0  2900 1412 1204 S  0.0  0.1   0:01.34 init
    2 root      20   0     0    0    0 S  0.0  0.0   0:00.00 kthreadd
    3 root      RT   0     0    0    0 S  0.0  0.0   0:00.00 migration/0
    4 root      20   0     0    0    0 S  0.0  0.0   0:00.00 ksoftirqd/0
    5 root      RT   0     0    0    0 S  0.0  0.0   0:00.00 stopper/0
    6 root      RT   0     0    0    0 S  0.0  0.0   0:00.00 watchdog/0
    7 root      RT   0     0    0    0 S  0.0  0.0   0:00.00 migration/1
    8 root      RT   0     0    0    0 S  0.0  0.0   0:00.00 stopper/1
    9 root      20   0     0    0    0 S  0.0  0.0   0:00.00 ksoftirqd/1
   10 root      RT   0     0    0    0 S  0.0  0.0   0:00.00 watchdog/1
.................................
3.1. System running time and average load
top-21:50:48up4min,2users,loadaverage:0.00,0.02,0.00
illustrate:
3.2、Task
Tasks:102total,1running,101sleeping,0stopped,0zombie
illustrate:
The second line shows the summary of the task or process. Processes can be in different states. The number of all processes is shown here. In addition, there are the number of running, sleeping, stopped, and zombie processes (zombie is a state of a process). This process summary information can be toggled with 't'.
3.3, CPU status
Cpu(s):0.5%us,0.8%sy,0.0%ni,98.4%id,0.2%wa,0.0%hi,0.1%si,0.0%st
illustrate:
3.4. Memory usage
Mem:1030416ktotal,141908kused,888508kfree,14684kbuffers
Swap:2047996ktotal,0kused,2047996kfree,51848kcached
illustrate:
接出来两行显示显存使用率linux定时关机命令,有点像'free'命令。第一行是化学显存使用,第二行是虚拟显存使用(交换空间)。化学显存显示如下:全部可用显存、已使用显存、空闲显存、缓冲显存。相像地:交换部份显示的是:全部、已使用、空闲和缓冲交换空间。显存显示可以用'm'命令切换。
3.5、字段列
  PID USER      PR  NI  VIRT  RES  SHR S %CPU %MEM    TIME+  COMMAND
    1 root      20   0  2900 1412 1204 S  0.0  0.1   0:01.34 init
    2 root      20   0     0    0    0 S  0.0  0.0   0:00.00 kthreadd
    3 root      RT   0     0    0    0 S  0.0  0.0   0:00.00 migration/0
    4 root      20   0     0    0    0 S  0.0  0.0   0:00.00 ksoftirqd/0
    5 root      RT   0     0    0    0 S  0.0  0.0   0:00.00 stopper/0
    6 root      RT   0     0    0    0 S  0.0  0.0   0:00.00 watchdog/0
    7 root      RT   0     0    0    0 S  0.0  0.0   0:00.00 migration/1
    8 root      RT   0     0    0    0 S  0.0  0.0   0:00.00 stopper/1
    9 root      20   0     0    0    0 S  0.0  0.0   0:00.00 ksoftirqd/1
   10 root      RT   0     0    0    0 S  0.0  0.0   0:00.00 watchdog/1
说明:
S:这个是进程的状态。它有以下不同的值:
D-不可中断的睡眠态。

R–运行态
S–睡眠态
T–被跟踪或已停止
Z–僵尸态
还有许多在默认情况下不会显示的输出,它们可以显示进程的页错误、有效组和组ID和其他更多的信息。
二、htop命令
1、htop命令简介
top作为日常管理工作中最常用也是最重要的Linux系统监控工具之一,可以动态观察系统进程状况。但其缺点就是只支持鼠标操作,显示也单调。作为刚刚Windows转入Linux的我来说,现今有了一个更好的选择:htop。htop是Linux系统下一个基本文本模式的、交互式的进程查看器,主要用于控制台或shell中,可以取代top,或则说是top的中级版。
htop命令优点:
1)快速查看关键性能统计数据,如CPU(多核布局)、内存/交换使用;
2)可以纵向或横向滚动浏览进程列表,以查看所有的进程和完整的命令行;
3)杀坠入程时可以直接选择而不须要输入进程号;
4)通过键盘操作条目;
5)比top启动得更快;
2、安装htop
[root@example.com ~]# yum install -y htop
3、常用功能键

键入htop命令,打开htop:
里面左上角显示CPU、内存、交换区的使用情况,右侧显示任务、负载、开机时间,下边就是进程实时状况。
下边是F1~F10的功能和对应的字母快捷键:
命令行选项(COMMAND-LINEOPTIONS):
Interactive commands (INTERACTIVECOMMANDS):
4. Display instructions
The left part from top to bottom is the usage of CPU, memory and swap partition. The right part is: Tasks is the total number of processes, the number of currently running processes, Loadaverage is the system 1 minute, 5 Minutes, the average load condition in 10 minutes, and Uptime is the system running time.
5. htop usage instructions
F1: Display help information


F2Htop Settings

Under Setup option:
Set the display information at the top, divided into left and right sides. Leftcolumn represents the information displayed on the left linux htoplinux htop, Rightcolumn represents the information displayed on the left. If you want to add a new option, you can select Availablemeters to add, F5 to add to the upper two sides, F6 to add to the upper two sides. The options under Leftcolumn and Rightcolumn can select the information display method, including LED, Bar (progress bar), and Text (text mode), which can be set according to personal preferences

Select the content to be displayed, press space x to display it, after selecting, press F10 to save

Set the colors in which the interface is displayed.
The function is to reduce or cancel the various contents to be displayed. After selecting, F7 (downward communication), F8 (upward communication), F9 (cancel display, F10 (save changes)) will display this information according to individual needs.
F3 Search Process
Press F3 in the interface or directly enter "/" to directly enter the search mode, which searches based on the process name. Such as

The searched processes will be marked with the set color for easy viewing.
F4: Filter
Equivalent to fuzzy search, case-insensitive, after entering the content to be searched below, the interface will only display the searched content, making it more convenient to view, such as:
F5: Display in tree form
F6: Sorting method
After pressing F6, you will jump to the interface shown above, allowing you to choose which methods to sort. Under Sortby, select which methods you want to sort by.
F7,F8: Adjust the process nice value
F7 means to reduce the nice value (reduce the priority), F8 to reduce the nice value (reduce the priority) Linux command detailed dictionary, select a process, press F7 or F8 to reduce or decrease the nice value, the nice value range for -20-19.
F9: Kill process
Select a process and press F9 to kill this process.
F10:Exit htop
Extended learning:
The above is the detailed content of linux htop An in-depth understanding of the top command under Linux: performance analysis tools and common options. For more information, please follow other related articles on the PHP Chinese website!

 Mastering Text Manipulation With the Sed CommandMar 16, 2025 am 09:48 AM
The Linux command line interface provides a wealth of text processing tools, one of the most powerful tools is the sed command. sed is the abbreviation of Stream EDitor, a multi-functional tool that allows complex processing of text files and streams. What is Sed? sed is a non-interactive text editor that operates on pipeline inputs or text files. By providing directives, you can let it modify and process text in a file or stream. The most common use cases of sed include selecting text, replacing text, modifying original files, adding lines to text, or removing lines from text. It can be used from the command line in Bash and other command line shells. Sed command syntax sed
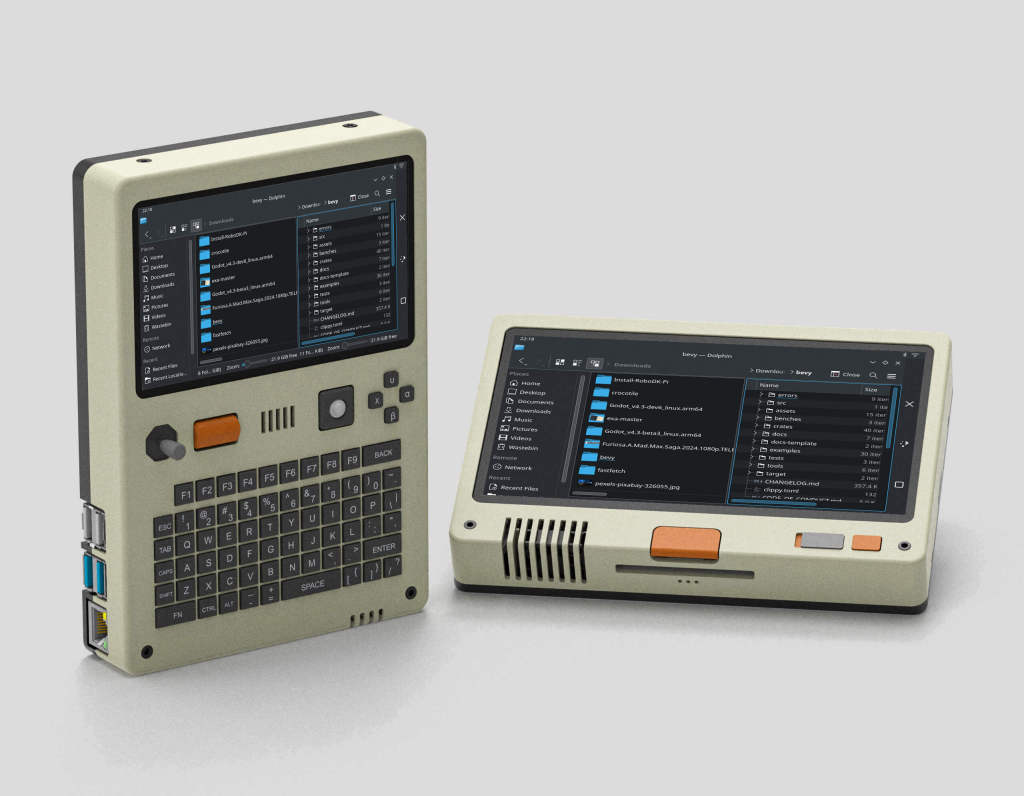 Pilet: A Modular, Portable Mini-Computer Powered by Raspberry PiMar 06, 2025 am 10:11 AM
Discover Pilet: A Retro-Futuristic, Open-Source Mini-Computer Looking for a mini-computer that blends classic style with cutting-edge technology? Meet Pilet, a modular, open-source marvel powered by the Raspberry Pi 5. Boasting a 7-hour battery life
 Linux Kernel Source Code Surpasses 40 Million LinesMar 05, 2025 am 09:35 AM
Linux: The cornerstone of modern computing, from smartphones to supercomputers, can do everything. Over the years, the size and complexity of the Linux kernel has increased significantly. As of January 2025, the Linux kernel source code contains approximately 40 million lines of code! This is one of the greatest achievements in the history of open source, community-driven projects. This article will discuss the exponential growth of the number of lines in the Linux kernel source code, the reasons and how to check the current number of lines by yourself. Directory -Linux kernel history Count the number of lines of the Linux kernel source code only count C and header files Exponential trend of kernel growth Verify historical Linux kernel lines Summary Linux kernel history Since 1991 Linus Tor
 How To Count Files And Directories In Linux: A Beginner's GuideMar 19, 2025 am 10:48 AM
Efficiently Counting Files and Folders in Linux: A Comprehensive Guide Knowing how to quickly count files and directories in Linux is crucial for system administrators and anyone managing large datasets. This guide demonstrates using simple command-l
 System76 Introduces Meerkat Mini PC: Big Power in a Tiny PackageMar 05, 2025 am 10:28 AM
The System76 Meerkat: A Mighty Mini PC Looking for a powerful yet space-saving computer? Meet the Meerkat mini PC from System76! This compact powerhouse is perfect for tidy desktops and demanding tasks. Table of Contents - Compact Design, Impressive
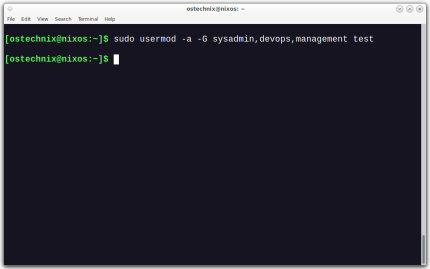 How To Add A User To Multiple Groups In LinuxMar 18, 2025 am 11:44 AM
Efficiently managing user accounts and group memberships is crucial for Linux/Unix system administration. This ensures proper resource and data access control. This tutorial details how to add a user to multiple groups in Linux and Unix systems. We
 The Secret Weapon to Supercharge Your Linux System With Liquorix KernelMar 08, 2025 pm 12:12 PM
Liquorix kernel: a powerful tool to improve Linux system performance Linux is known for its flexibility, security and high performance, becoming the operating system of choice for developers, system administrators, and advanced users. However, the universal Linux kernel is not always meeting the needs of users seeking maximum performance and responsiveness. This is where the Liquorix kernel comes into play—a performance-optimized alternative that promises to enhance your Linux system. This article will explore what the Liquorix kernel is, why you might want to use it, and how to install and configure it to get the most out of your system. Liquorix kernel detailed explanation Liquorix kernel is a precompiled Linux kernel designed for
 Building Your Own Ubuntu Personal Cloud: A Step-by-Step Guide to Creating a Secure Data HavenMar 05, 2025 am 11:02 AM
In today's digital age, data is not just information, but also a part of our lives. From photos and documents to sensitive personal information, our data represents our memories, work and interests. Although cloud storage services are widely available, they are often accompanied by privacy concerns, subscription fees, and customization restrictions. That's what building a personal cloud on Ubuntu is about as a powerful alternative, which gives you complete control over your data and the flexibility to customize and scale as needed. This guide will guide you to set up a Ubuntu-based personal cloud, use Nextcloud as the primary application, and ensure your settings are secure and reliable. Why build a personal cloud on Ubuntu? Ubuntu is the most popular Linux


Hot AI Tools

Undresser.AI Undress
AI-powered app for creating realistic nude photos

AI Clothes Remover
Online AI tool for removing clothes from photos.

Undress AI Tool
Undress images for free

Clothoff.io
AI clothes remover

AI Hentai Generator
Generate AI Hentai for free.

Hot Article
Hot Tools

Safe Exam Browser
Safe Exam Browser is a secure browser environment for taking online exams securely. This software turns any computer into a secure workstation. It controls access to any utility and prevents students from using unauthorized resources.

PhpStorm Mac version
The latest (2018.2.1) professional PHP integrated development tool

MinGW - Minimalist GNU for Windows
This project is in the process of being migrated to osdn.net/projects/mingw, you can continue to follow us there. MinGW: A native Windows port of the GNU Compiler Collection (GCC), freely distributable import libraries and header files for building native Windows applications; includes extensions to the MSVC runtime to support C99 functionality. All MinGW software can run on 64-bit Windows platforms.

WebStorm Mac version
Useful JavaScript development tools

mPDF
mPDF is a PHP library that can generate PDF files from UTF-8 encoded HTML. The original author, Ian Back, wrote mPDF to output PDF files "on the fly" from his website and handle different languages. It is slower than original scripts like HTML2FPDF and produces larger files when using Unicode fonts, but supports CSS styles etc. and has a lot of enhancements. Supports almost all languages, including RTL (Arabic and Hebrew) and CJK (Chinese, Japanese and Korean). Supports nested block-level elements (such as P, DIV),

