
Home >Web Front-end >JS Tutorial >Use Baidu Map JSAPI to generate h7n9 avian influenza distribution map implementation code_javascript skills
Use Baidu Map JSAPI to generate h7n9 avian influenza distribution map implementation code_javascript skills

- WBOYWBOYWBOYWBOYWBOYWBOYWBOYWBOYWBOYWBOYWBOYWBOYWBOriginal
- 2016-05-16 17:36:561222browse
The picture below is an example of the H7N9 infection distribution map generated using Baidu Maps JSAPI. The data comes from Xinhuanet (No. 4.8). The screenshot is as follows: 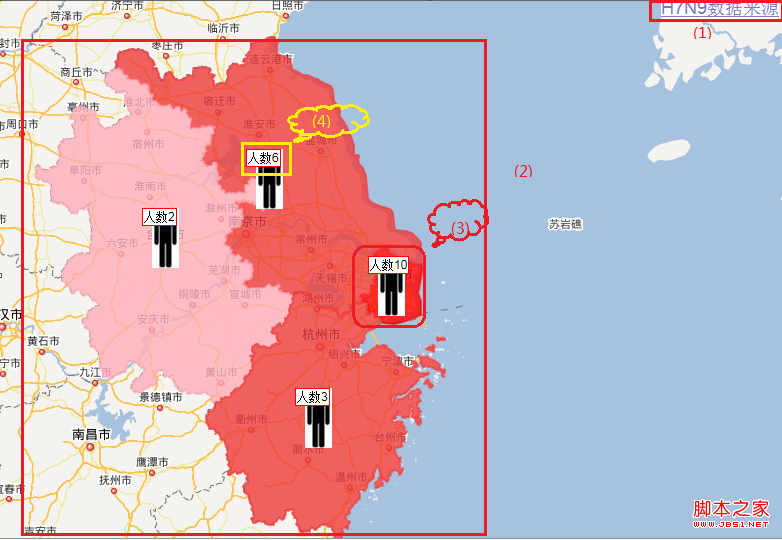
The list of functions used is as follows:
1. Auto Define the copyright control function, that is, (1) the corresponding data source part, the code is as follows:
Copy the code The code is as follows:
var cr = new BMap.CopyrightControl({anchor: BMAP_ANCHOR_TOP_RIGHT});
map.addControl(cr); //Add copyright control
var bs = map.getBounds();
cr.addCopyright({id: 1, content: "H7N9 data source", bounds: bs});
2. Get the administrative boundary function, that is, corresponding to (2) Four provinces and cities boundaries, the code is as follows:
Copy the code The code is as follows:
var bdary = new BMap.Boundary();//Administrative boundary service
var length=data.length;
for (var index=0;index
(function(index) { //Closure usage
bdary.get(data[index].city, function(rs){ //Get the administrative area
var count = rs.boundaries.length; //How many polygons are there in the administrative area? Composition
var bounds;
var center;
for(var i = 0; i < count; i ){
ply = new BMap.Polygon(rs.boundaries[i], {strokeWeight : 2, strokeColor: data[index].color,fillColor: data[index].color,fillOpacity:0.8 }); //Create a polygon cover
if (!bounds)//Get the first component of the administrative area The center point of ;
})(index);
}
3. Add marker points and labels, i.e. (3,4) to display pictures of people and labels representing the number of infected people:
The code is as follows: var myIcon = new BMap.Icon("infection.png", new BMap.Size(27,60)); var marker1 = new BMap.Marker(center,{icon:myIcon}); // marker map.addOverlay(marker1); var label = new BMap.Label("Number of people" data[index].infect,{offset:new BMap.Size(-10,0)});//Display label
marker1.setLabel(label); The complete code is as follows:
The code is as follows:
H7N9分布图
Done!
Done!
Statement:
The content of this article is voluntarily contributed by netizens, and the copyright belongs to the original author. This site does not assume corresponding legal responsibility. If you find any content suspected of plagiarism or infringement, please contact admin@php.cn
Previous article:Solution to user login system in JS_Basic knowledgeNext article:Solution to user login system in JS_Basic knowledge
Related articles
See more- An in-depth analysis of the Bootstrap list group component
- Detailed explanation of JavaScript function currying
- Complete example of JS password generation and strength detection (with demo source code download)
- Angularjs integrates WeChat UI (weui)
- How to quickly switch between Traditional Chinese and Simplified Chinese with JavaScript and the trick for websites to support switching between Simplified and Traditional Chinese_javascript skills