
Home >Web Front-end >JS Tutorial >Web Inspector: Introduction to debugging Js in Sublime Text_Basic Knowledge
Web Inspector: Introduction to debugging Js in Sublime Text_Basic Knowledge

- WBOYWBOYWBOYWBOYWBOYWBOYWBOYWBOYWBOYWBOYWBOYWBOYWBOriginal
- 2016-05-16 17:36:322349browse
Sublime Text is an excellent cross-platform editor with a beautiful user interface and powerful features, such as code thumbnails, multiple selections, shortcut commands, etc. Key bindings, menus and toolbars can also be customized. The main features of Sublime Text include: spell check, bookmarks, complete Python API, Goto function, instant project switching, multi-selection, multi-window and more.
In addition, Sublime Text has many plug-ins, which can be easily installed and managed through package management tools. The Sublime Web Inspector introduced in this article is an excellent development assistance plug-in among many plug-ins, which can help web developers debug JavaScript code directly in Sublime Text.
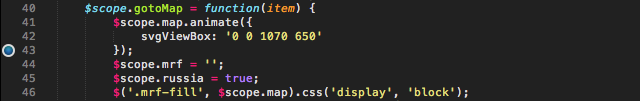
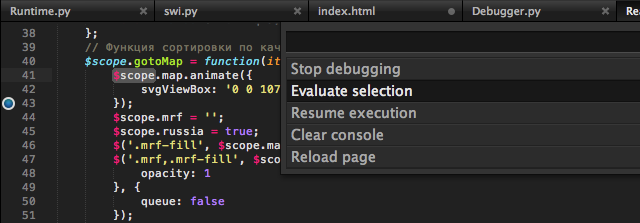
The main features of Sublime Web Inspector are as follows: BreakpointIn the editor, you can set and delete breakpoints.
View all console messages sorted by level.
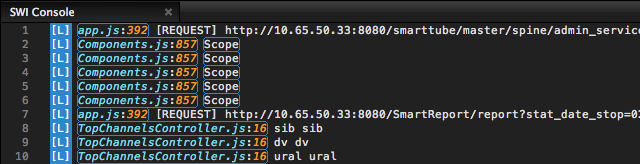
Click the name:line area to navigate to the file and line of code; click Object to plug in the properties of the object.
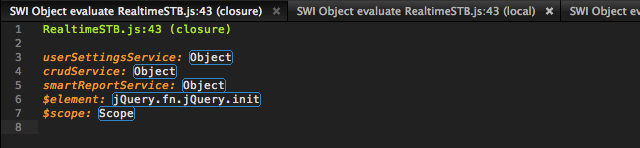
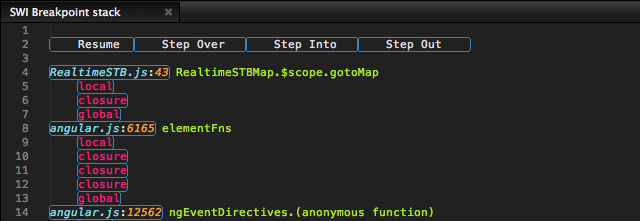
At the breakpoint, you can see the stack of the code running and all variables (local, global, closure).
Add monitoring functionality similar to Firebug.
Related articles
See more- An in-depth analysis of the Bootstrap list group component
- Detailed explanation of JavaScript function currying
- Complete example of JS password generation and strength detection (with demo source code download)
- Angularjs integrates WeChat UI (weui)
- How to quickly switch between Traditional Chinese and Simplified Chinese with JavaScript and the trick for websites to support switching between Simplified and Traditional Chinese_javascript skills