Home >Web Front-end >JS Tutorial >jqplot methods and ideas for dynamically drawing line charts through ajax_javascript skills
jqplot methods and ideas for dynamically drawing line charts through ajax_javascript skills
- WBOYWBOYWBOYWBOYWBOYWBOYWBOYWBOYWBOYWBOYWBOYWBOYWBOriginal
- 2016-05-16 17:10:281152browse

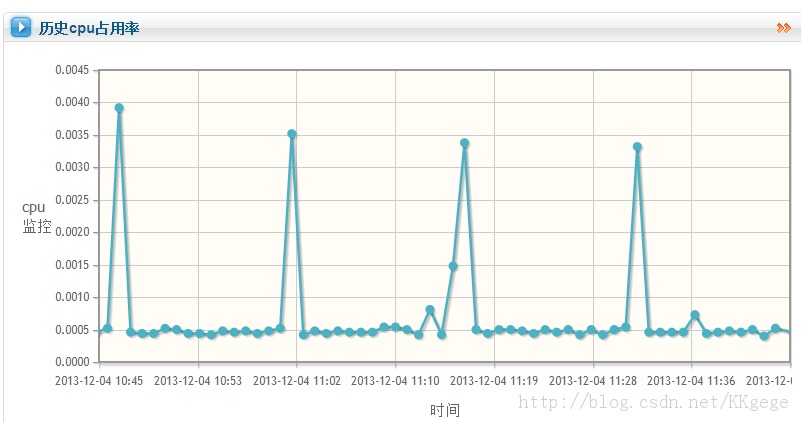
The effect is as shown in the picture. The picture will move every five seconds (actually a new picture is drawn), which can display the monitored CPU information.
pastCpuInfomation function is mainly used to display a line chart
The updateCpuPic function removes the picture 5 seconds ago and draws a new picture based on the existing data.
updateCpuInfomation function adds the latest points to the array storing polylines
Then set up two timers in the interface and ask them to execute updateCpuPic every 5 seconds and updateCpuInfomation every 1 minute, and the pictures will start to move.
PS: Before performing many operations in the code, the current time of the server will be obtained from the server. The ajax writing is a bit messy, and I don’t know if it is standardized. The method of implementing dynamic graphics does not seem to be very good. It is best to I hope my friends can give me some advice if I can update the line data directly! The code for drawing the table has been marked in red (line 30 to line 60)
var past_cpu_service_statistics_line = new Array();
var plot;
function pastCpuInfomation() {
// Historical cpu data
// Local time
$ .ajax({
type: "POST",
contentType: "application/x-www-form-urlencoded;charset=UTF-8",
url: globalObj.path '/server/getServerCurrentTime. htm',
success: function(currentTime){
console.log("Get server time" currentTime);
//Get historical cpu data
$.ajax({
Type : "POST",
contentType: "application/x-www-form-urlencoded;charset=UTF-8",
url: globalObj.path '/server/getPastCpuMonitorData.htm',
// startTime endtime is dummy data, and the time is obtained in the background
// Go to get the time to int
var Intkey = PARSEINT (key);
VAR TransferTime = New Date (intKey);
Console. Log ("TRANSFERTIME:" Key "---- -resut:" transferTime);
var onePoint = [transferTime, result[key] ];
past_cpu_service_statistics_line.push(onePoint);
}
through
renderer: $.jqplot.DateAxisRenderer,
formatString: '%Y-%#m-%d %H: %M '},
min: (Currenttime -1000 * 60 * 60),
Max: (Currenttime),
// horizontal (vertical) minimum value
yaxis: {
🎜> ,
show: true,
highlighter: {
sizeAdjust : 7.5
show: false
}
});
}
}); Historical cpu data ajax end
},
error: function(textStatus){
alert("Failed to obtain server time when fetching historical cpu data!"); );
}
function updateCpuPic() {
console.log("Updating cpu view");
//Get the server time first and use it to draw the abscissa
$.ajax({
type: "POST",
contentType: "application/x-www-form-urlencoded;charset=UTF-8",
url: globalObj.path '/server/getServerCurrentTime .htm',
success: function(result){
var intKey =parseInt(result);
var transferTime = new Date(intKey);
console.log("Get server time: " result "------" transferTime);
;
}
: {
label: 'Time',
renderer: $.jqplot.DateAxisRenderer,
},
60 * 60),
max: (result),
// The minimum value displayed by the horizontal (vertical) coordinates
// ticks:['']
},
yaxis: {
label: 'cpu monitoring',
}
} ,
highlighter: {
show: true,
sizeAdjust: 7.5
},
cursor: {
show: false
},
replot: {
resetAxes: true
🎜> error: function(textStatus){
alert("Failed to get server time!");
function updateCpuInfomation() {
$.ajax({
type: "POST",
contentType: "application/x-www-form-urlencoded;charset=UTF-8" ,
url: globalObj.path '/server/getLatestCpuMonitorData.htm',
data: "hostName=" "login.cheos.cn",
success: function(result){
// Update the data once
for (key in result) {
var intKey = parseInt(key);
var transferTime = new Date(intKey);
console.log("- ----- ----------Update cpu information---:" key "----Update time:" transferTime);
var onePoint = [transferTime, result[key]]; .push(onePoint);
}
alert("Update cpu information Failed!");
}
});
}
Related articles
See more- An in-depth analysis of the Bootstrap list group component
- Detailed explanation of JavaScript function currying
- Complete example of JS password generation and strength detection (with demo source code download)
- Angularjs integrates WeChat UI (weui)
- How to quickly switch between Traditional Chinese and Simplified Chinese with JavaScript and the trick for websites to support switching between Simplified and Traditional Chinese_javascript skills

