Heim >Backend-Entwicklung >Python-Tutorial >Das „Hands-on' in der Palettenwelt-palettierbar
Das „Hands-on' in der Palettenwelt-palettierbar
- Python当打之年nach vorne
- 2023-08-10 15:13:392227Durchsuche
Einige Freunde sagen, dass die integrierten Farben der Python-Visualisierung hässlich sind. Dann sind Sie bestimmt noch nie auf palettable gestoßen. Paletable ist eine in reinem Python geschriebene Farbbalkenbibliothek (Colormap), die zusammenführt Eine große Anzahl bekannter Visualisierungen Die Farbleiste der Software (z. B. das Tableau-Farbsystem, einige Matplotlib-Farbsysteme usw.) verfügt über insgesamt 1587 Arten von Farbleisten (Colormap) und Zehntausende Einzelfarben verwendet werden. Dieser Artikel stellt detailliert vor, wie man Paletten verwendet .
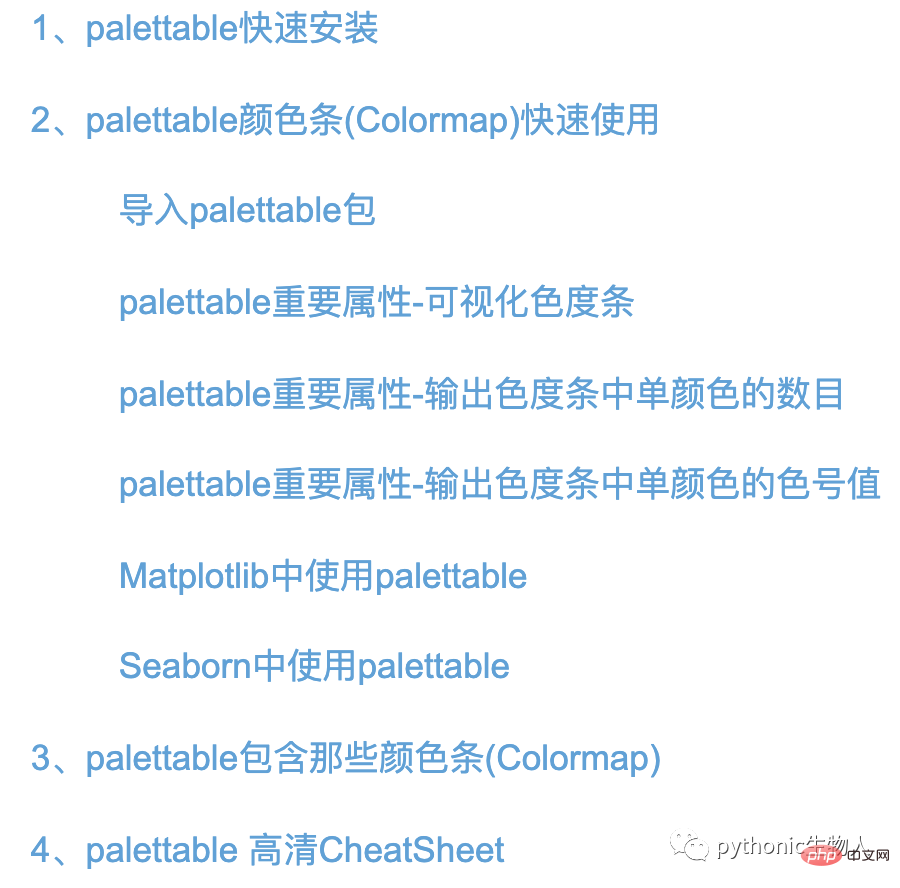
Inhaltsverzeichnis dieses Artikels
1. Schnelle Installation von Palettenfarbe
pip install palettable -i https://pypi.tuna.tsinghua.edu.cn/simple
import palettable
from palettable.cartocolors.qualitative import Bold_9

#为了描述方便,此处直接倒入palettable.cartocolors.qualitative大类下的Bold_9小类,
#实际使用时可直接用palettable.cartocolors.qualitative.Bold_9

Bold_9.show_discrete_image()#Bold_9各种颜色条图片
9 Das heißt , das obige Bild hat 9 Gitter
print(Bold_9.number)#Bold_9这种colormap中单颜色的数目
[[127, 60, 141], [17, 165, 121], [57, 105, 172], [242, 183, 1], [231, 63, 116], [128, 186, 90], [230, 131, 16], [0, 134, 149], [207 , 28, 144]][' #7F3C8D', '#11A579', '#3969AC', '#F2B701', '#E73F74', '#80BA5A', '#E68310', '#008695', ' #CF1C90 '] [(0,4980392156862745, 0,23529411764705882, 0,5529411764705883), (0,06666666666667, 0,647058823582352352352980390390390390390390390390390390390390390390390390390390390390390390390390390390390390390390390390390390390390390390390390390390390390390390390398039080803 235294117647059, 0,4117647058823529, 0,6745098039215687), (0,9490196078431372, 0,717647058235294, 0,00392156215621562156237488) (. 24705882352941178, 0,4549019607843137), (0,5019607843137255, 0,7294117647058823, 0,35294117647058826, (0,9019607843137255, 0,5137254901960784, 0,06274509803921569), (0,0, 0,5254901960784 314, 0,5843137254901961, (0,8117647058823529, 0,10980392156862745, 0,56470588235 29412)]
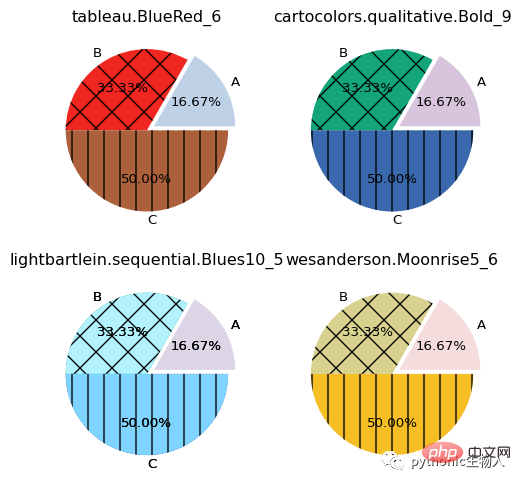
Matplotlib中使用palettable
import matplotlib.pyplot as plt
import matplotlib as mpl
import palettable

mpl.rc_file_defaults()
my_dpi = 96
plt.figure(figsize=(580 / my_dpi, 580 / my_dpi), dpi=my_dpi)
plt.subplot(221)
patches, texts, autotexts = plt.pie(
    x=[1, 2, 3],
    labels=['A', 'B', 'C'],
    #使用palettable.tableau.BlueRed_6
    colors=palettable.tableau.BlueRed_6.mpl_colors[0:3],
    autopct='%.2f%%',
    explode=(0.1, 0, 0))

patches[0].set_alpha(0.3)
patches[2].set_hatch('|')
patches[1].set_hatch('x')
plt.title('tableau.BlueRed_6', size=12)

mpl.rc_file_defaults()
plt.subplot(222)

patches, texts, autotexts = plt.pie(
    x=[1, 2, 3],
    labels=['A', 'B', 'C'],
    #使用palettable.cartocolors.qualitative.Bold_9
    colors=palettable.cartocolors.qualitative.Bold_9.mpl_colors[0:3],
    autopct='%.2f%%',
    explode=(0.1, 0, 0))

patches[0].set_alpha(0.3)
patches[2].set_hatch('|')
patches[1].set_hatch('x')
plt.title('cartocolors.qualitative.Bold_9', size=12)

mpl.rc_file_defaults()
plt.subplot(223)

patches, texts, autotexts = plt.pie(
    x=[1, 2, 3],
    labels=['A', 'B', 'C'],
    #使用palettable.cartocolors.qualitative.Bold_9
    colors=palettable.cartocolors.qualitative.Bold_9.mpl_colors[0:3],
    autopct='%.2f%%',
    explode=(0.1, 0, 0))

patches[0].set_alpha(0.3)
patches[2].set_hatch('|')
patches[1].set_hatch('x')
plt.title('cartocolors.qualitative.Bold_9', size=12)

plt.subplot(223)

patches, texts, autotexts = plt.pie(
    x=[1, 2, 3],
    labels=['A', 'B', 'C'],
    #使用palettable.lightbartlein.sequential.Blues10_5
    colors=palettable.lightbartlein.sequential.Blues10_5.mpl_colors[0:3],
    autopct='%.2f%%',
    explode=(0.1, 0, 0))

#matplotlib.patches.Wedge
patches[0].set_alpha(0.3)
patches[2].set_hatch('|')
patches[1].set_hatch('x')
plt.title('lightbartlein.sequential.Blues10_5', size=12)

plt.subplot(224)

patches, texts, autotexts = plt.pie(
    x=[1, 2, 3],
    labels=['A', 'B', 'C'],
    colors=palettable.wesanderson.Moonrise5_6.mpl_colors[0:3],
    autopct='%.2f%%',
    explode=(0.1, 0, 0))

patches[0].set_alpha(0.3)
patches[2].set_hatch('|')
patches[1].set_hatch('x')
plt.title('wesanderson.Moonrise5_6', size=12)
plt.show()
Seaborn中使用palettable
 例子来自几行代码绘制靓丽矩阵图
使用palettable.tableau.TrafficLight_9
import seaborn as sns
iris_sns = sns.load_dataset("iris")

import palettable

g = sns.pairplot(
    iris_sns,
    hue='species',
    palette=palettable.tableau.TrafficLight_9.mpl_colors,  #Matplotlib颜色
)
sns.set(style='whitegrid')
g.fig.set_size_inches(10, 8)
sns.set(style='whitegrid', font_scale=1.5)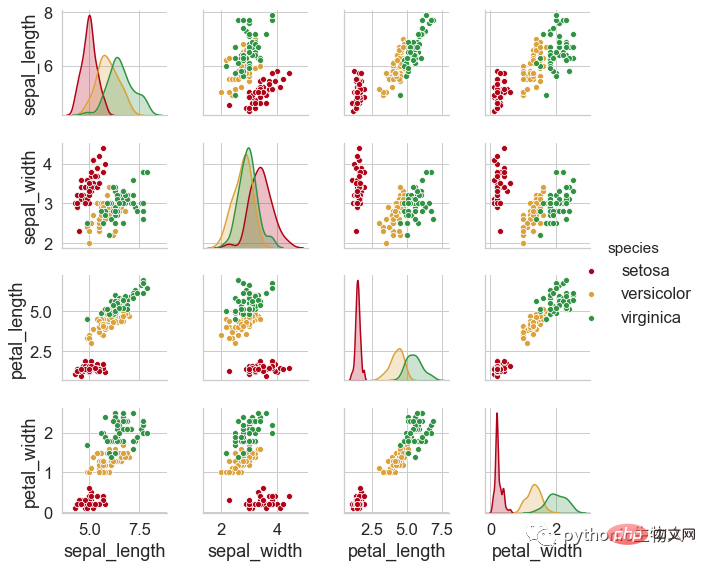
使用palettable.tableau.BlueRed_6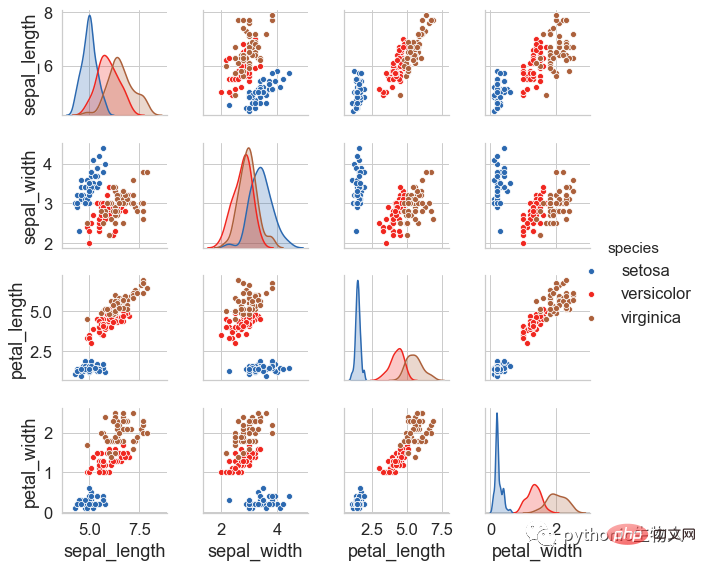 使用palettable.cartocolors.qualitative.Bold_9
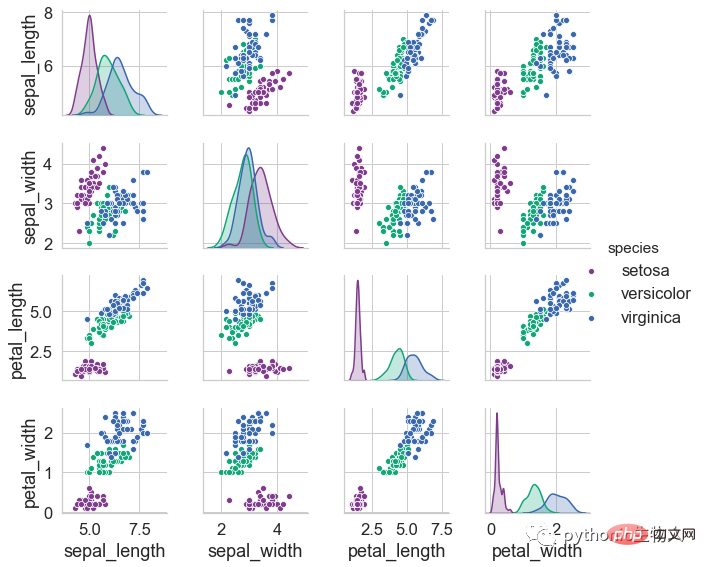 使用palettable.wesanderson.Moonrise5_6
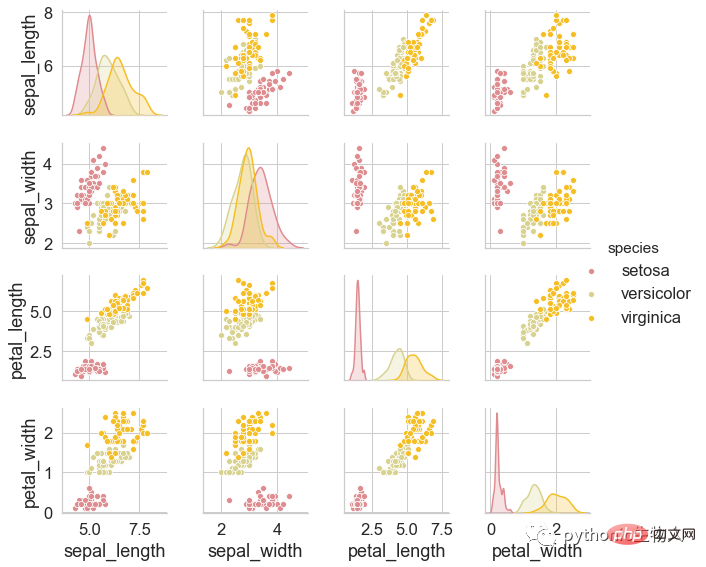 使用palettable.cartocolors.diverging.ArmyRose_7_r
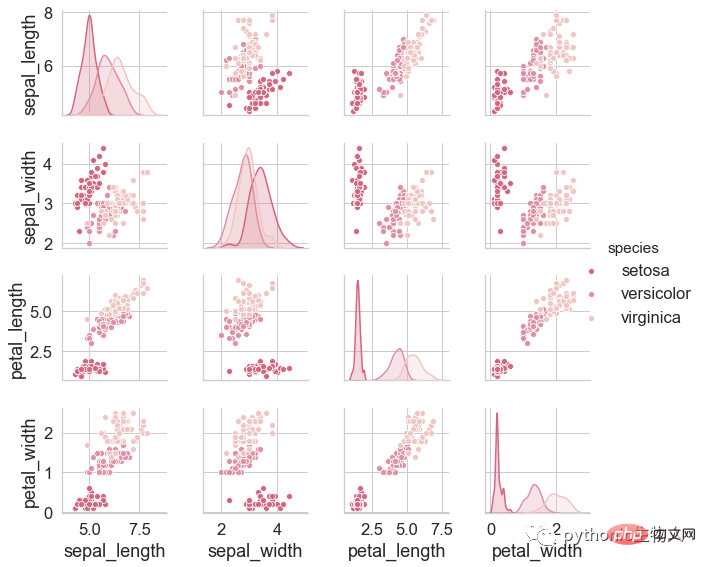
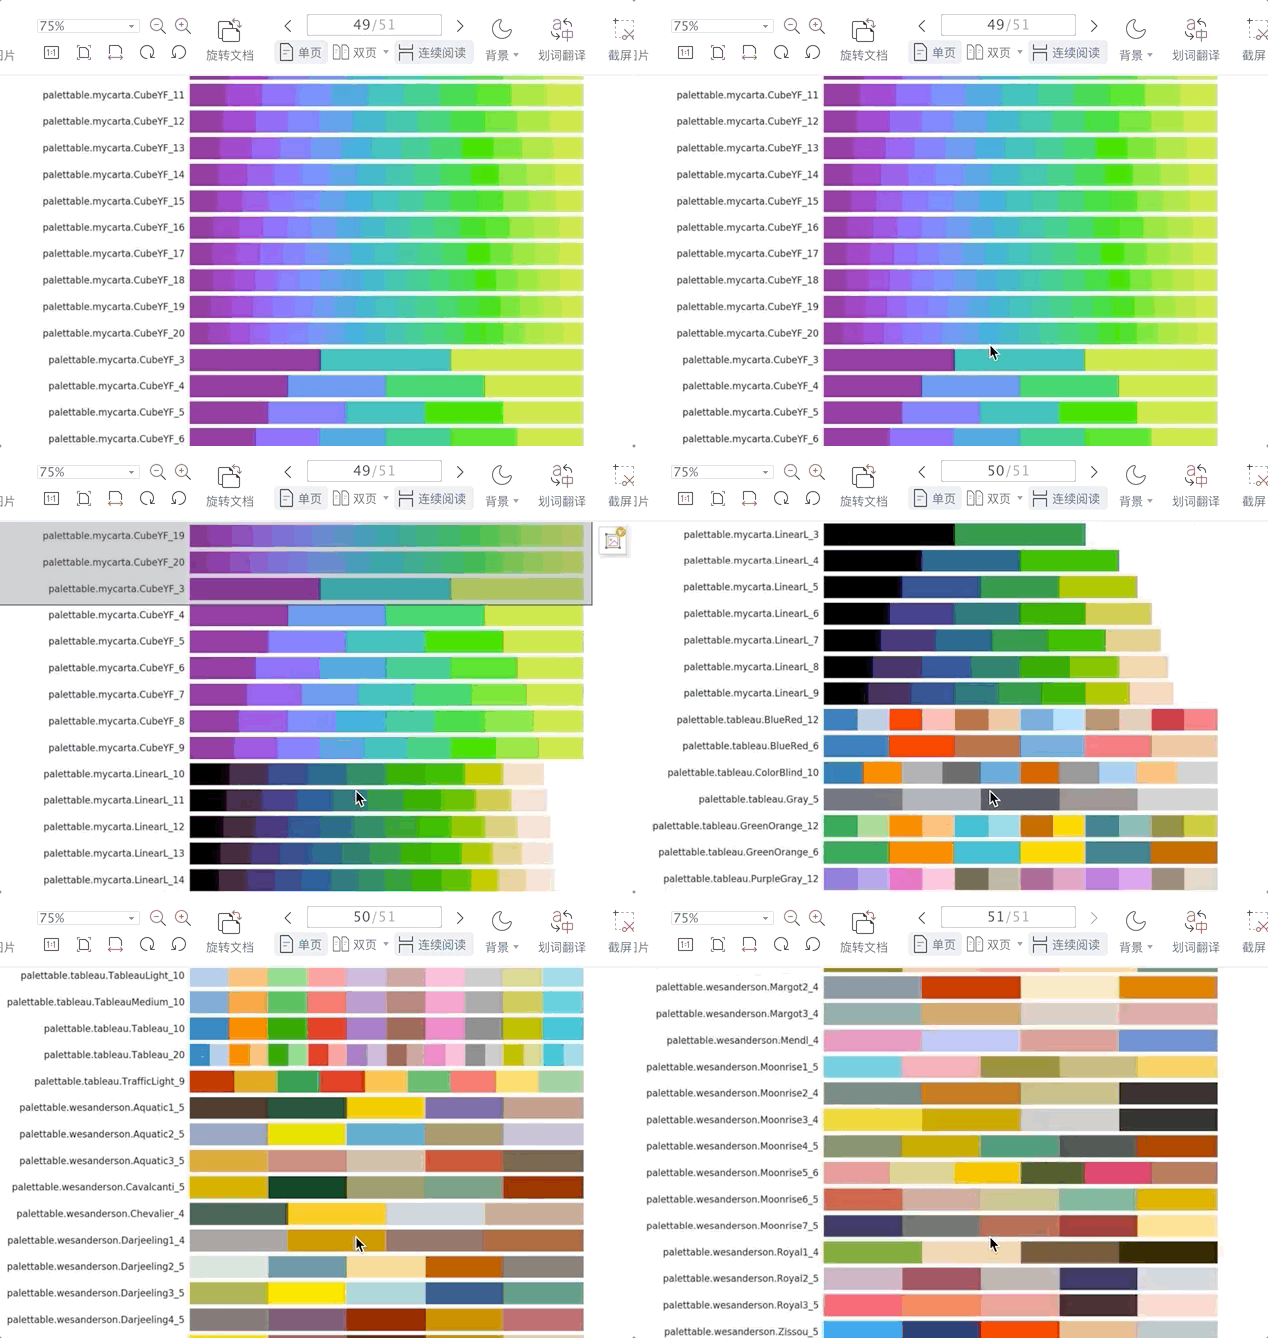
3、palettable包含那些颜色条(Colormap)
palettable下面有16大类Colormap,共计1587小类Colormap,合计上万种单颜色可供使用,已经整理为pdf格式,感兴趣的可以
包含以下16大类
palettable.cartocolors.diverging
palettable.cartocolors.qualitative
palettable.cartocolors.sequential
palettable.cmocean.diverging
palettable.cmocean.sequential
palettable.colorbrewer.diverging
palettable.colorbrewer.qualitative
palettable.colorbrewer.sequential
palettable.lightbartlein.diverging
palettable.lightbartlein.sequential
palettable.scientific.diverging
palettable.scientific.sequential
palettable.matplotlib
palettable.mycarta
palettable.tableau
palettable.wesanderson
共计1587小类【每个小类还有逆类,名称后面加“_r”即可】上面16大类下面有数个小类,例如,著名BI软件Tableau的配色条palettable.tableau这一大类,下面有palettable.tableau.BlueRed_12,palettable.tableau.GreenOrange_12等等数个小类:
palettable.tableau.BlueRed_12
palettable.tableau.BlueRed_6
palettable.tableau.ColorBlind_10
palettable.tableau.Gray_5
palettable.tableau.GreenOrange_12
palettable.tableau.GreenOrange_6
palettable.tableau.PurpleGray_12
palettable.tableau.PurpleGray_6
palettable.tableau.TableauLight_10
palettable.tableau.TableauMedium_10
palettable.tableau.Tableau_10
palettable.tableau.Tableau_20
palettable.tableau.TrafficLight_9
也就是类似上面的这种有1587行。
Das obige ist der detaillierte Inhalt vonDas „Hands-on' in der Palettenwelt-palettierbar. Für weitere Informationen folgen Sie bitte anderen verwandten Artikeln auf der PHP chinesischen Website!


