
Heim >Backend-Entwicklung >Python-Tutorial >4000 Wörter ausführliche Beschreibung mit Empfehlungen zu 20 nützlichen Pandas-Funktionsmethoden
4000 Wörter ausführliche Beschreibung mit Empfehlungen zu 20 nützlichen Pandas-Funktionsmethoden

- Python当打之年nach vorne
- 2023-08-10 14:52:501429Durchsuche
Heute werde ich ein paar unbekannte pandas Funktionen vorstellen, von denen Sie vielleicht nicht viele sehen, aber sie sind sehr bequem zu verwenden und können auch unseren Datenanalysten dabei helfen, große Fortschritte zu machen. Verbessern Sie die Arbeitseffizienz und ich hoffe, dass jeder nach der Lektüre etwas gewinnen kann
items()方法iterrows()方法insert()方法assign()方法eval()方法pop()方法truncate()方法count()方法add_prefix()方法/add_suffix()方法clip()方法-
filter()🎜
insert()方法🎜🎜🎜🎜 eval()方法🎜🎜🎜🎜truncate()方法🎜🎜🎜🎜count()方法🎜🎜🎜🎜add_prefix()方法/clip()方法🎜🎜🎜🎜first()方法isin()方法df.plot.area()方法df.plot.bar()方法df.plot.box()方法df.plot.pie()方法
items()方法
items()方法可以用来遍历数据集当中的每一列,同时返回列名以及每一列当中的内容,通过以元组的形式,示例如下df = pd.DataFrame({'species': ['bear', 'bear', 'marsupial'],
'population': [1864, 22000, 80000]},
index=['panda', 'polar', 'koala'])
dfoutput
         species  population
panda       bear        1864
polar       bear       22000
koala  marsupial       80000
然后我们使用items()方法
for label, content in df.items():
    print(f'label: {label}')
    print(f'content: {content}', sep='\n')
    print("=" * 50)
output
label: species
content: panda         bear
polar         bear
koala    marsupial
Name: species, dtype: object
==================================================
label: population
content: panda     1864
polar    22000
koala    80000
Name: population, dtype: int64
==================================================
相继的打印出了‘species’和‘population’这两列的列名和相应的内容
iterrows()方法
iterrows() li>df.plot.area() 方法🎜🎜🎜df.plot.box()方法🎜🎜🎜df.plot.pie()方法🎜
items()方法
items()方法🎜for label, content in df.iterrows():
print(f'label: {label}')
print(f'content: {content}', sep='\n')
print("=" * 50)🎜output🎜label: panda content: species bear population 1864 Name: panda, dtype: object ================================================== label: polar content: species bear population 22000 Name: polar, dtype: object ================================================== label: koala content: species marsupial population 80000 Name: koala, dtype: object ==================================================🎜相继的打印出了'species'和'population'这两列的列名和相应的内容🎜
iterrows()方法
iterrows()Sie können dies auch tun每一行的内容,示例如下🎜df.insert(1, "size", [2000, 3000, 4000])🎜output🎜
label: panda
content: species       bear
population    1864
Name: panda, dtype: object
==================================================
label: polar
content: species        bear
population    22000
Name: polar, dtype: object
==================================================
label: koala
content: species       marsupial
population        80000
Name: koala, dtype: object
==================================================
insert()方法
insert()方法主要是用于在数据集当中的特定位置处插入数据,示例如下
df.insert(1, "size", [2000, 3000, 4000])
output
         species  size  population
panda       bear  2000        1864
polar       bear  3000       22000
koala  marsupial  4000       80000
可见在DataFrame数据集当中,列的索引也是从0开始的
assign()方法
assign()方法可以用来在数据集当中添加新的列,示例如下
df.assign(size_1=lambda x: x.population * 9 / 5 + 32)
output
         species  population    size_1
panda       bear        1864    3387.2
polar       bear       22000   39632.0
koala  marsupial       80000  144032.0
lambda匿名函数,在数据集当中添加一个新的列,命名为‘size_1’,当然我们也可以通过assign()方法来创建不止一个列df.assign(size_1 = lambda x: x.population * 9 / 5 + 32,
size_2 = lambda x: x.population * 8 / 5 + 10)output
         species  population    size_1    size_2
panda       bear        1864    3387.2    2992.4
polar       bear       22000   39632.0   35210.0
koala  marsupial       80000  144032.0  128010.0
eval()方法
eval()方法主要是用来执行用字符串来表示的运算过程的,例如
df.eval("size_3 = size_1 + size_2")output
         species  population    size_1    size_2    size_3
panda       bear        1864    3387.2    2992.4    6379.6
polar       bear       22000   39632.0   35210.0   74842.0
koala  marsupial       80000  144032.0  128010.0  272042.0
当然我们也可以同时对执行多个运算过程
df = df.eval('''
size_3 = size_1 + size_2
size_4 = size_1 - size_2
''')
output
         species  population    size_1    size_2    size_3   size_4
panda       bear        1864    3387.2    2992.4    6379.6    394.8
polar       bear       22000   39632.0   35210.0   74842.0   4422.0
koala  marsupial       80000  144032.0  128010.0  272042.0  16022.0
pop()方法
pop()方法主要是用来删除掉数据集中特定的某一列数据
df.pop("size_3")output
panda      6379.6
polar     74842.0
koala    272042.0
Name: size_3, dtype: float64
而原先的数据集当中就没有这个‘size_3’这一例的数据了
truncate()方法
truncate()方法主要是根据行索引来筛选指定行的数据的,示例如下
df = pd.DataFrame({'A': ['a', 'b', 'c', 'd', 'e'],
                   'B': ['f', 'g', 'h', 'i', 'j'],
                   'C': ['k', 'l', 'm', 'n', 'o']},
                  index=[1, 2, 3, 4, 5])
output
   A  B  C
1  a  f  k
2  b  g  l
3  c  h  m
4  d  i  n
5  e  j  o
我们使用truncate()方法来做一下尝试
df.truncate(before=2, after=4)
output
   A  B  C
2  b  g  l
3  c  h  m
4  d  i  n
before和after存在于truncate()方法中,目的就是把行索引2之前和行索引4之后的数据排除在外,筛选出剩余的数据
count()方法
count()方法主要是用来计算某一列当中非空值的个数,示例如下
df = pd.DataFrame({"Name": ["John", "Myla", "Lewis", "John", "John"],
                   "Age": [24., np.nan, 25, 33, 26],
                   "Single": [True, True, np.nan, True, False]})
output
    Name   Age Single
0   John  24.0   True
1   Myla   NaN   True
2  Lewis  25.0    NaN
3   John  33.0   True
4   John  26.0  False
我们使用count()方法来计算一下数据集当中非空值的个数
df.count()
output
Name      5
Age       4
Single    4
dtype: int64
add_prefix()方法/add_suffix()方法
add_prefix()方法和add_suffix()方法分别会给列名以及行索引添加后缀和前缀,对于Series()数据集而言,前缀与后缀是添加在行索引处,而对于DataFrame()数据集而言,前缀与后缀是添加在列索引处,示例如下s = pd.Series([1, 2, 3, 4])
output
0    1
1    2
2    3
3    4
dtype: int64
我们使用add_prefix()方法与add_suffix()方法在Series()数据集上
s.add_prefix('row_')
output
row_0    1
row_1    2
row_2    3
row_3    4
dtype: int64
又例如
s.add_suffix('_row')
output
0_row    1
1_row    2
2_row    3
3_row    4
dtype: int64
DataFrame()形式数据集而言,add_prefix()方法以及add_suffix()方法是将前缀与后缀添加在列索引处的df = pd.DataFrame({'A': [1, 2, 3, 4], 'B': [3, 4, 5, 6]})output
   A  B
0  1  3
1  2  4
2  3  5
3  4  6
示例如下
df.add_prefix("column_")output
   column_A  column_B
0         1         3
1         2         4
2         3         5
3         4         6
又例如
df.add_suffix("_column")output
   A_column  B_column
0         1         3
1         2         4
2         3         5
3         4         6
clip()方法
clip()方法主要是通过设置阈值来改变数据集当中的数值,当数值超过阈值的时候,就做出相应的调整data = {'col_0': [9, -3, 0, -1, 5], 'col_1': [-2, -7, 6, 8, -5]}
df = pd.DataFrame(data)output
df.clip(lower = -4, upper = 4)
output
   col_0  col_1
0      4     -2
1     -3     -4
2      0      4
3     -1      4
4      4     -4
lower和upper分别代表阈值的上限与下限,数据集当中超过上限与下限的值会被替代。
filter()方法
pandas当中的filter()方法是用来筛选出特定范围的数据的,示例如下
df = pd.DataFrame(np.array(([1, 2, 3], [4, 5, 6], [7, 8, 9], [10, 11, 12])),
                  index=['A', 'B', 'C', 'D'],
                  columns=['one', 'two', 'three'])
output
   one  two  three
A    1    2      3
B    4    5      6
C    7    8      9
D   10   11     12
我们使用filter()方法来筛选数据
df.filter(items=['one', 'three'])
output
   one  three
A    1      3
B    4      6
C    7      9
D   10     12
我们还可以使用正则表达式来筛选数据
df.filter(regex='e$', axis=1)
output
   one  three
A    1      3
B    4      6
C    7      9
D   10     12
当然通过参数axis来调整筛选行方向或者是列方向的数据
df.filter(like='B', axis=0)
output
   one  two  three
B    4    5      6
first()方法
当数据集当中的行索引是日期的时候,可以通过该方法来筛选前面几行的数据
index_1 = pd.date_range('2021-11-11', periods=5, freq='2D')
ts = pd.DataFrame({'A': [1, 2, 3, 4, 5]}, index=index_1)
ts
output
            A
2021-11-11  1
2021-11-13  2
2021-11-15  3
2021-11-17  4
2021-11-19  5
我们使用first()方法来进行一些操作,例如筛选出前面3天的数据
ts.first('3D')
output
            A
2021-11-11  1
2021-11-13  2
isin()方法
isin()方法主要是用来确认数据集当中的数值是否被包含在给定的列表当中
df = pd.DataFrame(np.array(([1, 2, 3], [4, 5, 6], [7, 8, 9], [10, 11, 12])),
                  index=['A', 'B', 'C', 'D'],
                  columns=['one', 'two', 'three'])
df.isin([3, 5, 12])
output
     one    two  three
A  False  False   True
B  False   True  False
C  False  False  False
D  False  False   True
True,否则就返回False
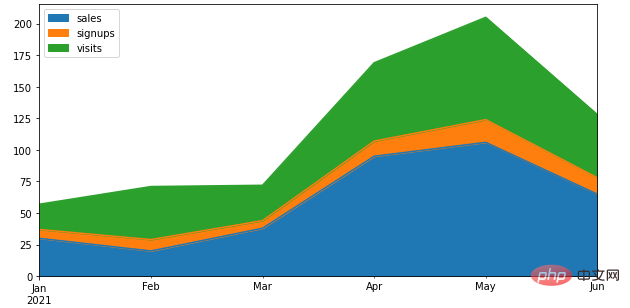
df.plot.area()方法
Pandas当中通过一行代码来绘制图表,将所有的列都通过面积图的方式来绘制df = pd.DataFrame({
'sales': [30, 20, 38, 95, 106, 65],
'signups': [7, 9, 6, 12, 18, 13],
'visits': [20, 42, 28, 62, 81, 50],
}, index=pd.date_range(start='2021/01/01', end='2021/07/01', freq='M'))
ax = df.plot.area(figsize = (10, 5))output
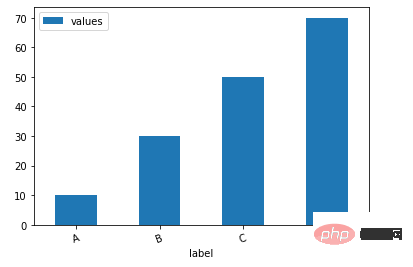
df.plot.bar()方法
下面我们看一下如何通过一行代码来绘制柱状图
df = pd.DataFrame({'label':['A', 'B', 'C', 'D'], 'values':[10, 30, 50, 70]})
ax = df.plot.bar(x='label', y='values', rot=20)
output
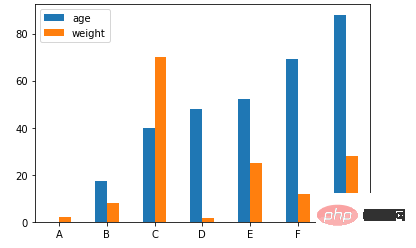
当然我们也可以根据不同的类别来绘制柱状图
age = [0.1, 17.5, 40, 48, 52, 69, 88]
weight = [2, 8, 70, 1.5, 25, 12, 28]
index = ['A', 'B', 'C', 'D', 'E', 'F', 'G']
df = pd.DataFrame({'age': age, 'weight': weight}, index=index)
ax = df.plot.bar(rot=0)
output
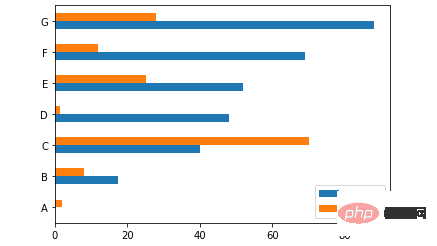
当然我们也可以横向来绘制图表
ax = df.plot.barh(rot=0)
output
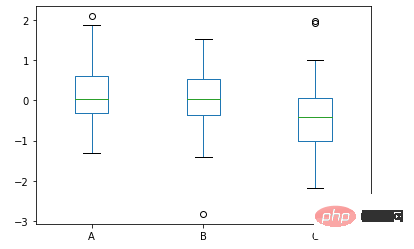
df.plot.box()方法
我们来看一下箱型图的具体的绘制,通过pandas一行代码来实现
data = np.random.randn(25, 3)
df = pd.DataFrame(data, columns=list('ABC'))
ax = df.plot.box()
output
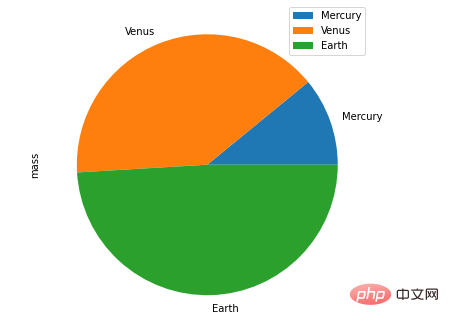
df.plot.pie()方法
接下来是饼图的绘制
df = pd.DataFrame({'mass': [1.33, 4.87 , 5.97],
                   'radius': [2439.7, 6051.8, 6378.1]},
                  index=['Mercury', 'Venus', 'Earth'])
plot = df.plot.pie(y='mass', figsize=(8, 8))
output
除此之外,还有折线图、直方图、散点图等等,步骤与方式都与上述的技巧有异曲同工之妙,大家感兴趣的可以自己另外去尝试。
Das obige ist der detaillierte Inhalt von4000 Wörter ausführliche Beschreibung mit Empfehlungen zu 20 nützlichen Pandas-Funktionsmethoden. Für weitere Informationen folgen Sie bitte anderen verwandten Artikeln auf der PHP chinesischen Website!
In Verbindung stehende Artikel
Mehr sehen- Beispielcode zum Summieren von Zeilen und Spalten und zum Hinzufügen neuer Zeilen und Spalten in pandas.DataFrame in Python
- Einführung in die Methode zum Lesen und Schreiben von CSV-Dateien in Pandas (mit Code)
- Was bedeutet Reichweite in Python?
- Pandas ausführlichstes Tutorial
- So generieren Sie Zufallszahlen in Python