Heim >Backend-Entwicklung >Python-Tutorial >Python-matplotlib |. Dual-Y-Achsen-Grafiken zeichnen (Legendeneinstellungen)
Python-matplotlib |. Dual-Y-Achsen-Grafiken zeichnen (Legendeneinstellungen)
- Python当打之年nach vorne
- 2023-08-09 16:06:302778Durchsuche
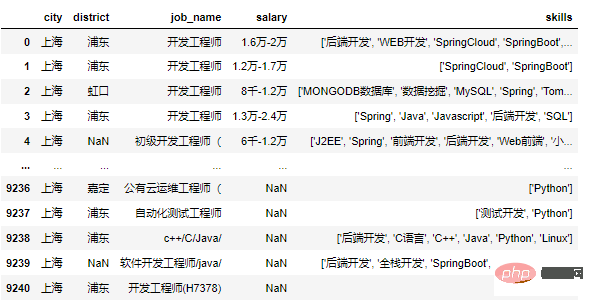 2. Fügen Sie eine y-Achse durch ax1.twinx( ):
 df = pd.read_csv('jobdata.csv')
3. 单独设置图例
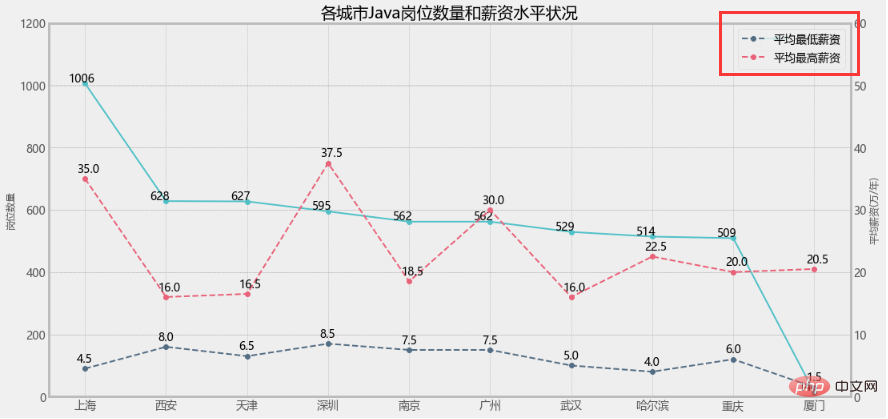
ax1.legend(loc='best')
ax2.legend(loc='best')
ax1.legend(loc=2)
ax2.legend(loc=1)
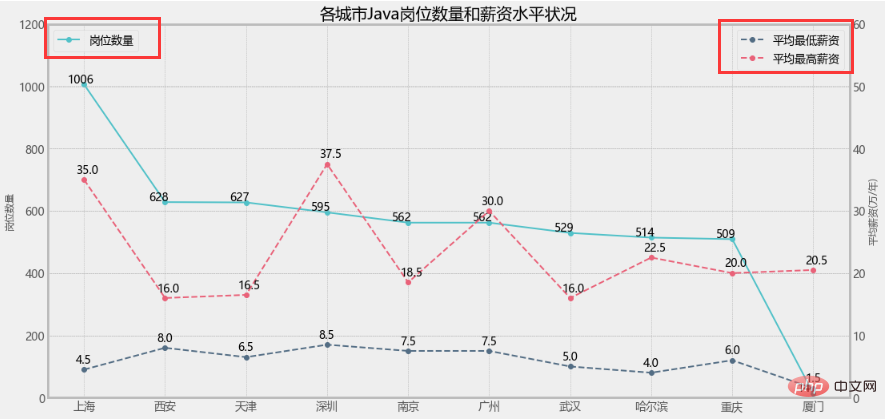
这样看就比较直观了,但是我就想把三个图例放一起不可以吗?
当然可以!
3. 设置组合图例
lines = lin0+lin1+lin2
labs = [label.get_label() for label in lines]
plt.legend(lines,labs)
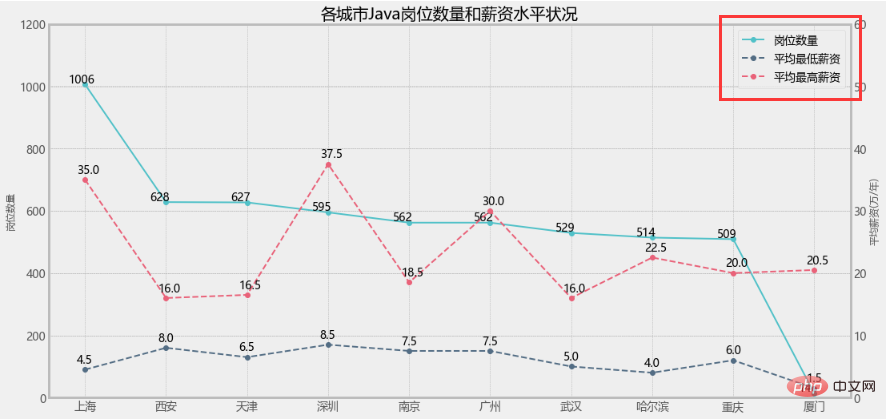
大功告成!
但是!如果是柱状图+折线图的情况,效果还一样吗?
但是!如果是柱状图+折线图的情况,效果还一样吗?
但是!如果是柱状图+折线图的情况,效果还一样吗?
1. 修改岗位数量为柱状图
plt.figure(figsize=(16, 8))
a1 = plt.subplot(111)
a1.set_ylim(0,1200)
bar = a1.bar(x_data, y_data1, color=colors[0], label='岗位数量')
for x, y in enumerate(y_data1):
    plt.text(x - 0.2, y+5, y)
a1.set_ylabel('岗位数量',fontsize=12)

...

lines = bar+lin1+lin2
labs = [label.get_label() for label in lines]
plt.legend(lines,labs)
直接报错了!


Der Eingabeaufforderungstyp ist offensichtlich ein Problem mit der Art des Balkens und der Linie. Schauen wir uns den Quellcode an:
matplotlib.axes. Axes.bar: 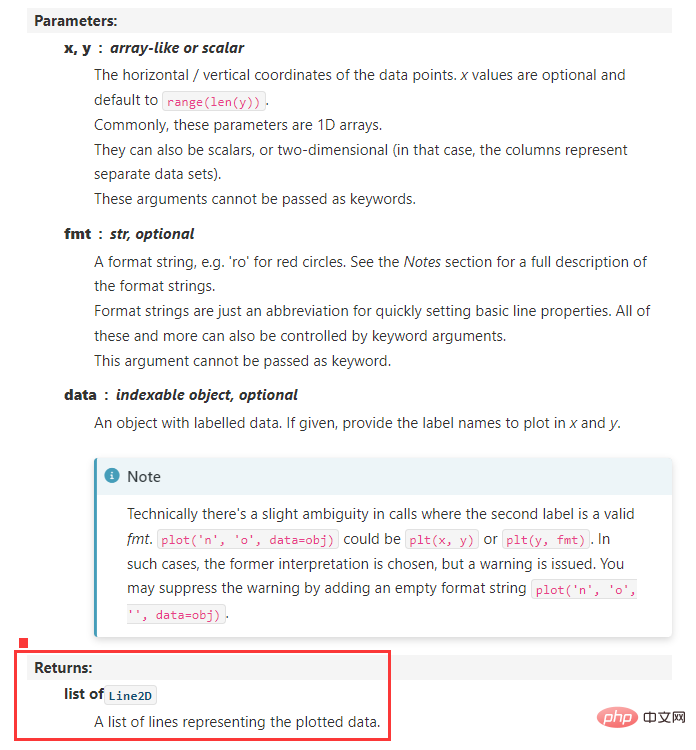
ax.plot gibt eine Liste vom Typ Line2D zurück, und ax.bar gibt ein Tupel vom Typ patches zurück. Nachdem wir die Grundursache gefunden haben, erstellen wir einfach eine Kombination aus Line2D und Patches. 2. 设置Line2D和patches的组合图例
legend_handles = [
    Line2D([], [], linewidth=1, ls='--', lw=2, c=colors[2], label='平均最高薪资'),
    Line2D([], [], linewidth=1, lw=2, c=colors[1], label='平均最低薪资'),
    patches.Rectangle((0, 0), 1, 1, facecolor=colors[0],label='岗位数量')
]
plt.legend(handles=legend_handles, loc='best', fontsize=14)
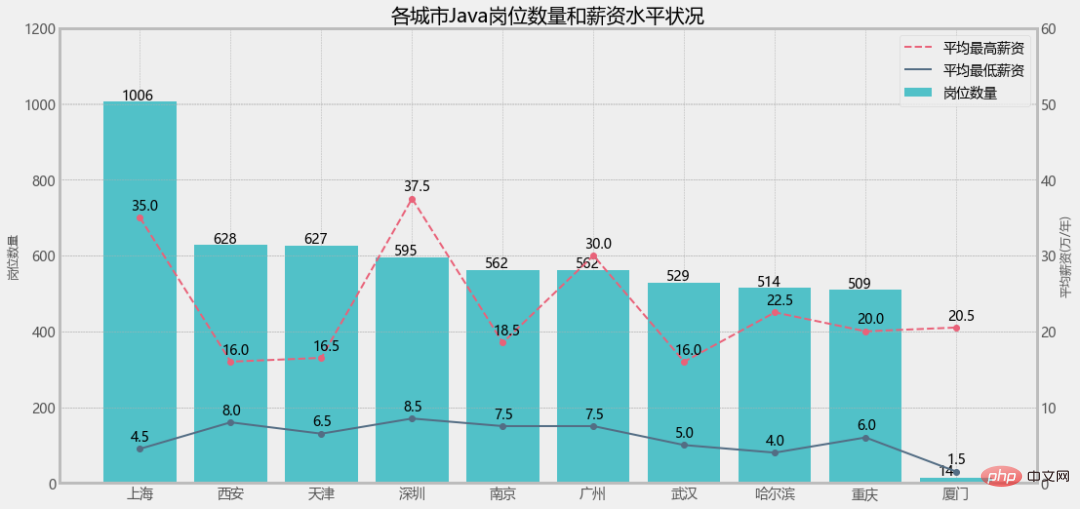
效果: 
其他参数大家可以自行尝试修改,对比前后效果,加深理解。
legend_handles = [
Line2D([], [], linewidth=1, ls='--', lw=2, c=colors[2], label='平均最高薪资'),
Line2D([], [], linewidth=1, lw=2, c=colors[1], label='平均最低薪资'),
patches.Rectangle((0, 0), 1, 1, facecolor=colors[0],label='岗位数量')
]
plt.legend(handles=legend_handles, loc='best', fontsize=14)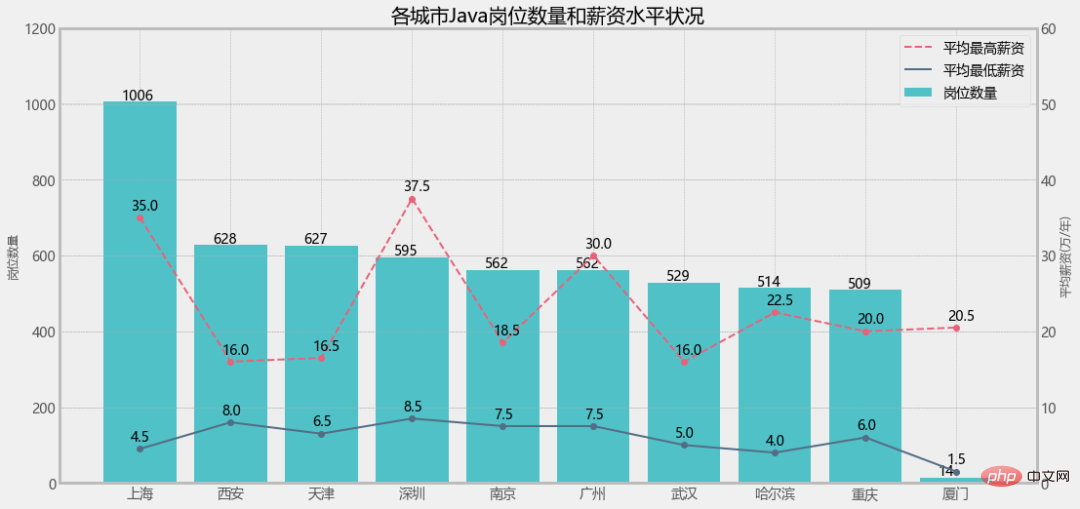
Das obige ist der detaillierte Inhalt vonPython-matplotlib |. Dual-Y-Achsen-Grafiken zeichnen (Legendeneinstellungen). Für weitere Informationen folgen Sie bitte anderen verwandten Artikeln auf der PHP chinesischen Website!
Stellungnahme:
Dieser Artikel ist reproduziert unter:Python当打之年. Bei Verstößen wenden Sie sich bitte an admin@php.cn löschen

