Heim >Backend-Entwicklung >Python-Tutorial >Python-Praxisreihe |. Regelmäßige Datenextraktion und -zeichnung
Python-Praxisreihe |. Regelmäßige Datenextraktion und -zeichnung
- Python当打之年nach vorne
- 2023-08-09 15:51:35758Durchsuche
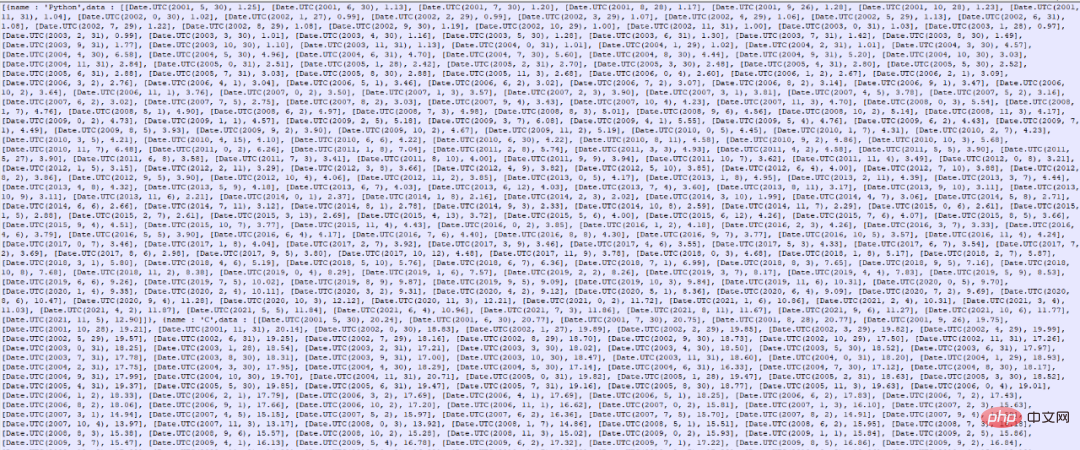
Auf den ersten Blick sieht es aus wie eine Datei im JSON-Format, ist es aber nicht wirklich 
 Kommen wir zum Punkt:
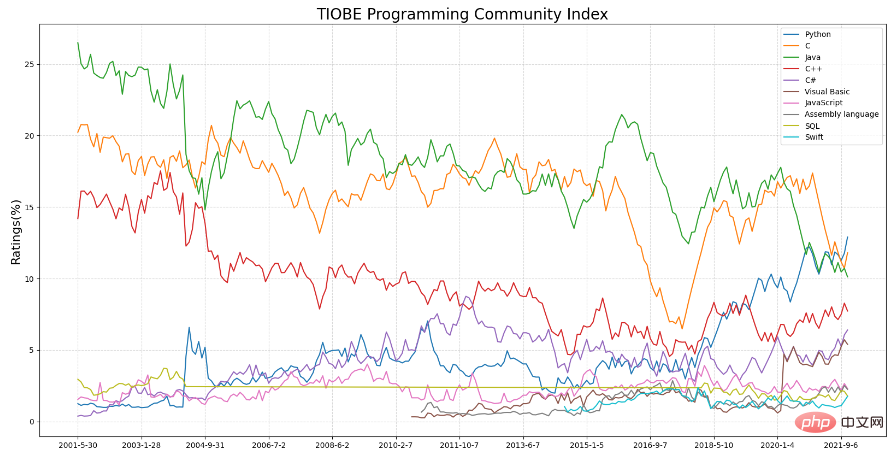
 ?️? 5. Der vollständige Code des Datenextraktionsteils ?️? 6. 绘图 绘图部分直接用matplotlib的plot循环绘制即可,代码如下:with open('data.txt') as f:
data = f.read()datas = re.findall('({.*?})',data)


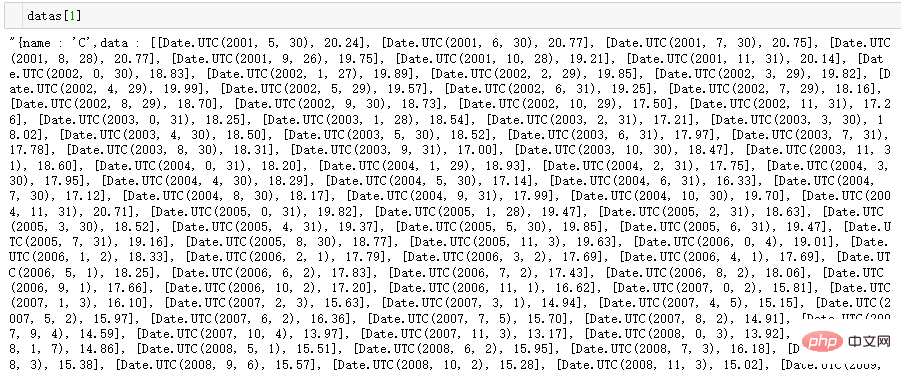
re.findall('\'(.*)\'',datas[0])[0]
re.findall('(\d+(\.\d+)?)',datas[0])
for i in range(0,len(datas_tmp),4):
    datas_f.append(float(datas_tmp[i+3][0]))
dates_f.append(f'{datas_tmp[i][0]}-{datas_tmp[i+1][0]}-{datas_tmp[i+2][0]}')# 绘图
plt.figure(figsize=(20, 10), dpi=100)
for i in range(len(names)):
plt.plot(dates_result[i], datas_result[i], label=names[i])
ax = plt.gca()
ax.xaxis.set_major_locator(ticker.MultipleLocator(20))
plt.ylabel("Ratings(%)", fontdict={'size': 16})
plt.title("TIOBE Programming Community Index", fontdict={'size': 20})
plt.legend(loc='best')
plt.grid(True, linestyle='--', alpha=0.5)
plt.show()
Das obige ist der detaillierte Inhalt vonPython-Praxisreihe |. Regelmäßige Datenextraktion und -zeichnung. Für weitere Informationen folgen Sie bitte anderen verwandten Artikeln auf der PHP chinesischen Website!

