Heim >Web-Frontend >js-Tutorial >So implementieren Sie das dynamische Laden des Histogramms in AngularJS
So implementieren Sie das dynamische Laden des Histogramms in AngularJS
- 亚连Original
- 2018-06-21 14:40:211645Durchsuche
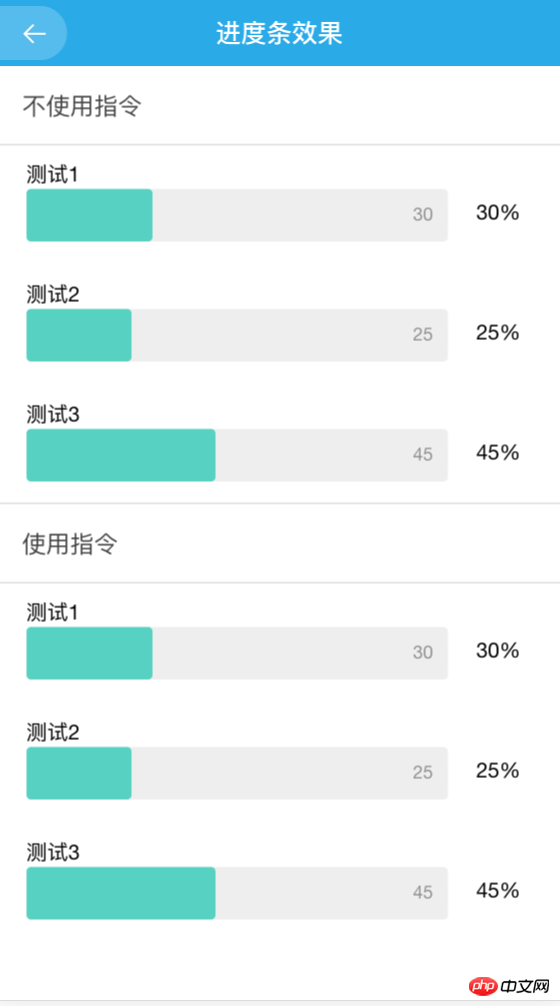
In diesem Artikel wird hauptsächlich das Beispiel des dynamischen Ladens von Histogrammen in AngularJS vorgestellt. Der Herausgeber findet es recht gut, daher werde ich es jetzt mit Ihnen teilen und als Referenz verwenden. Folgen wir dem Herausgeber, um einen Blick darauf zu werfen
Vorbereitung
1. Zitierte Dateien
Eine davon finden Sie im Link unten jquery.js-Datei, bitte zitieren Sie sie in index.html.
2. Erstellen Sie eine neue Datei
Erstellen Sie eine JS-Datei und schreiben Sie Anweisungen. Dies ist auch das erste Mal, dass ich Anweisungen schreibe. Sie sind hochgradig skalierbar und sehr praktisch. Wenn einige Effekte im Projekt wiederverwendet werden, können Anweisungen verwendet werden, um redundanten Code zu reduzieren.
Zweiter Code schreiben
/**
* Created by xiehan on 2017/12/8.
* 柱状图动态加载指令
*/
angular.module('studyApp.directives')
.directive('progressPer', function ($compile,$timeout) {
return {
restrict: 'AE',
scope: {
progressData: '='
},
template: ' <p class="progress-main" ng-repeat="item in progressData">'+
'<p class="progress-data">'+
'<span>{{item.name}}</span>'+
'<p class="skillbar clearfix " data-percent={{item.width}}>'+
'<p class="skillbar-bar"></p>'+
'<p class="skill-bar-percent">{{item.sum}}</p>'+
'</p>'+
'</p>'+
'<p class="progress-rate">{{item.percent}}</p>'+
'</p>',
replace: true,
transclude: true,
link: function (scope, element, attrs) {
$compile(element.contents())(scope.$new());
$timeout(function() {
jQuery('.skillbar').each(function(){
jQuery(this).find('.skillbar-bar').animate({
width:jQuery(this).attr('data-percent')
},1000);
});
});
}
}
});/**
* Created by xiehan on 2017/11/29.
* controller文件
*/
angular.module('studyApp.controllers')
.controller('ProgressCtrl', function ($scope, $rootScope, $ionicHistory,$timeout,$location) {
$scope.title = '进度条效果';
$scope.goBack = function () {
$ionicHistory.goBack();
};
var dataInfo=[
{
NAME:"测试1",
NUM:30,
RATE:30
},
{
NAME:"测试2",
NUM:25,
RATE:25
},
{
NAME:"测试3",
NUM:45,
RATE:45
}
];
handleTabData(dataInfo);
function handleTabData(data){
var widthData=[];
for(var i = 0;i<data.length;i++){
widthData.push({
width:data[i].RATE+'%', //进度条百分比
name:data[i].NAME, //标题
sum:data[i].NUM, //数量
percent:data[i].RATE+'%'}); //百分比
}
$scope.handleDataInfo = widthData;
//不使用指令加上下面的代码
// $timeout(function() {
// jQuery('.skillbar').each(function(){
// jQuery(this).find('.skillbar-bar').animate({
// width:jQuery(this).attr('data-percent')
// },1000);
// });
// });
}
});<ion-item>不使用指令</ion-item>
<p class="progress-main" ng-repeat="item in handleDataInfo">
<p class="progress-data">
<span>{{item.name}}</span>
<p class="skillbar clearfix " data-percent={{item.width}}>
<p class="skillbar-bar"></p>
<p class="skill-bar-percent">{{item.sum}}</p>
</p>
</p>
<p class="progress-rate">{{item.percent}}</p>
</p>
<ion-item>使用指令</ion-item>
<progress-per progress-data="handleDataInfo"></progress-per>/***************进度条样式css********/
.skillbar {
position: relative;
display: block;
margin-bottom: 15px;
width: 100%;
background: #eee; /**背景颜色**/
height: 35px;
border-radius: 3px;
-moz-border-radius: 3px;
-webkit-border-radius: 3px;
-webkit-transition: 0.4s linear;
-moz-transition: 0.4s linear;
-ms-transition: 0.4s linear;
-o-transition: 0.4s linear;
transition: 0.4s linear;
-webkit-transition-property: width, background-color;
-moz-transition-property: width, background-color;
-ms-transition-property: width, background-color;
-o-transition-property: width, background-color;
transition-property: width, background-color;
}
.skillbar-bar {
height: 35px;
width: 0px;
background: #50d2c2;
border-radius: 3px;
-moz-border-radius: 3px;
-webkit-border-radius: 3px;
}
.skill-bar-percent {
position: absolute;
right: 10px;
top: 0;
font-size: 11px;
height: 35px;
line-height: 35px;
color: #ffffff;
color: rgba(0, 0, 0, 0.4);
}
.progress-main{
display: flex;
display: -webkit-flex;
align-items: center;
-webkit-align-items: center;
justify-content: center;
-webkit-justify-content: center;
margin-top: 10px;
}
.progress-data{
margin-left: 5%;
width: 100%;
float: left;
}
.progress-rate{
float: right;
width: 20%;
line-height: 35px;
margin-left: 5%;
margin-top: 10px;
}Drei Renderings

Das Obige ist, was ich Für alle zusammengestellt, ich hoffe, dass es in Zukunft für alle hilfreich sein wird.
Verwandte Artikel:
So verwenden Sie Vue, um eine integrierte Iframe-Seite zu implementieren
Wie Sie die Funktion „Rendern“ in Vue rendern (ausführlich Tutorial)
Detaillierte Interpretation von Mixin in Vue
Über den Sortieralgorithmus von JS Hill (ausführliches Tutorial)
Das obige ist der detaillierte Inhalt vonSo implementieren Sie das dynamische Laden des Histogramms in AngularJS. Für weitere Informationen folgen Sie bitte anderen verwandten Artikeln auf der PHP chinesischen Website!
In Verbindung stehende Artikel
Mehr sehen- Eine eingehende Analyse der Bootstrap-Listengruppenkomponente
- Detaillierte Erläuterung des JavaScript-Funktions-Curryings
- Vollständiges Beispiel für die Generierung von JS-Passwörtern und die Erkennung der Stärke (mit Download des Demo-Quellcodes)
- Angularjs integriert WeChat UI (weui)
- Wie man mit JavaScript schnell zwischen traditionellem Chinesisch und vereinfachtem Chinesisch wechselt und wie Websites den Wechsel zwischen vereinfachtem und traditionellem Chinesisch unterstützen – Javascript-Kenntnisse

