Heim >Web-Frontend >HTML-Tutorial >Beispielcode zum Zeichnen eines Liniendiagramms mit HTML5
Beispielcode zum Zeichnen eines Liniendiagramms mit HTML5
- 不言Original
- 2018-05-08 15:33:263842Durchsuche
In diesem Artikel wird hauptsächlich der Beispielcode zum Zeichnen eines Liniendiagramms vorgestellt. Er hat einen gewissen Referenzwert. Jetzt können Freunde in Not darauf verweisen.
XML /HTML-Code Inhalt in die Zwischenablage kopieren
<html> <canvas id="a_canvas" width="1000" height="700"></canvas> <script> (function (){ window.addEventListener("load", function(){ var data = [100,-1000,0,700]; // 获取上下文 var a_canvas = document.getElementById('a_canvas'); var context = a_canvas.getContext("2d"); // 绘制背景 var gradient = context.createLinearGradient(0,0,0,300); // gradient.addColorStop(0,"#e0e0e0"); //gradient.addColorStop(1,"#ffffff"); context.fillStyle = gradient; context.fillRect(0,0,a_canvas.width,a_canvas.height); // 描绘边框 var grid_cols = data.length + 1; var grid_rows = 4; var cell_height = a_canvas.height / grid_rows; var cell_width = a_canvas.width / grid_cols; context.lineWidth = 1; context.strokeStyle = "#a0a0a0"; // 结束边框描绘 context.beginPath(); // 准备画横线 /*for (var col = 0; col <= grid_cols; col++) { var x = col * cell_width; context.moveTo(x,0); context.lineTo(x,a_canvas.height); } // 准备画竖线 for(var row = 0; row <= grid_rows; row++){ var y = row * cell_height; context.moveTo(0,y); context.lineTo(a_canvas.width, y); }*/ //划横线 context.moveTo(0,a_canvas.height/2); context.lineTo(a_canvas.width,a_canvas.height/2); //画竖线 context.moveTo(0,0); context.lineTo(0,a_canvas.height); context.lineWidth = 1; context.strokeStyle = "#c0c0c0"; context.stroke(); var max_v =0; for(var i = 0; i<data.length; i++){ var d=0; if(data[i]<0) {dd=d-data[i]; } else{d=data[i];}; if (d > max_v) { max_v =d}; } max_vmax_v = max_v * 1.1; // 将数据换算为坐标 var points = []; for( var i=0; i < data.length; i++){ var v= data[i]; var px = cell_width * (i +1); var py = a_canvas.height/2 - a_canvas.height*(v / max_v)/2; points.push({"x":px,"y":py}); } // 绘制折现 context.beginPath(); context.moveTo(points[0].x, points[0].y); for(var i= 1; i< points.length; i++){ context.lineTo(points[i].x,points[i].y); } context.lineWidth = 2; context.strokeStyle = "#8BA9FF"; context.stroke(); //绘制坐标图形 for(var i in points){ var p = points[i]; context.beginPath(); context.arc(p.x,p.y,4,0,2*Math.PI); //实心圆 /* context.fillStyle = "#000";*/ //空心圆 context.strokeStyle = "#000"; context.stroke(); context.fillStyle="white"; context.fill(); } //添加文字 for(var i in points) { var p = points[i]; context.beginPath(); context.fillStyle="black"; context.fillText(data[i], p.x + 1, p.y - 15); } },false); })(); </script> </html>
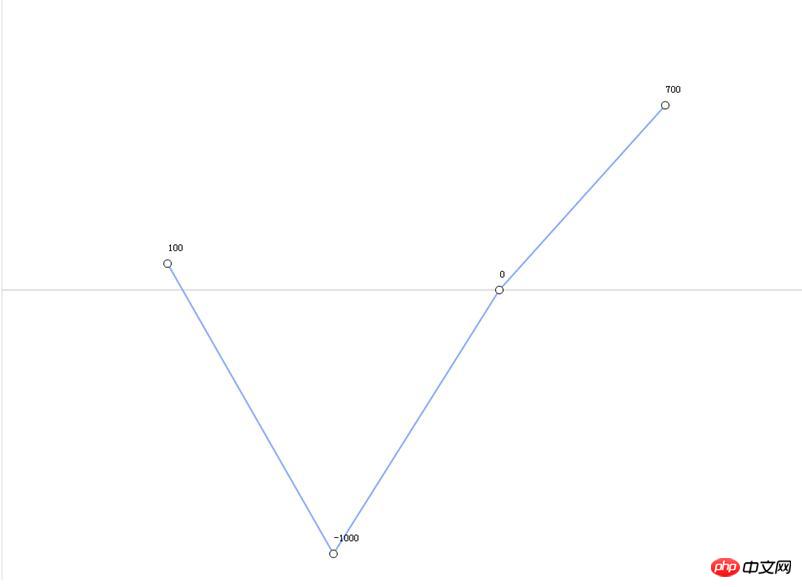
Die Ergebnisse sind wie folgt:

Verwandte Empfehlungen:
Zeichnen kreisförmiger Polygonmuster basierend auf HTML5_HTML5-Tutorial-Techniken
Das obige ist der detaillierte Inhalt vonBeispielcode zum Zeichnen eines Liniendiagramms mit HTML5. Für weitere Informationen folgen Sie bitte anderen verwandten Artikeln auf der PHP chinesischen Website!
Stellungnahme:
Der Inhalt dieses Artikels wird freiwillig von Internetnutzern beigesteuert und das Urheberrecht liegt beim ursprünglichen Autor. Diese Website übernimmt keine entsprechende rechtliche Verantwortung. Wenn Sie Inhalte finden, bei denen der Verdacht eines Plagiats oder einer Rechtsverletzung besteht, wenden Sie sich bitte an admin@php.cn
Vorheriger Artikel:HTML5-Imitation der WeChat-Chat-Schnittstelle für MobiltelefoneNächster Artikel:HTML5-Imitation der WeChat-Chat-Schnittstelle für Mobiltelefone

