Heim >Backend-Entwicklung >Python-Tutorial >Ausführliche Erläuterung von Beispielen zum Zeichnen von Grafiken mit Python
Ausführliche Erläuterung von Beispielen zum Zeichnen von Grafiken mit Python
- PHP中文网Original
- 2017-06-20 15:55:325525Durchsuche
1. Umgebung
System: Windows10
Python-Version: Python3.6.1
Verwendete Bibliotheken: Matplotlib, Numpy
2. Mehrere Möglichkeiten für die Numpy-Bibliothek, Zufallszahlen zu generieren
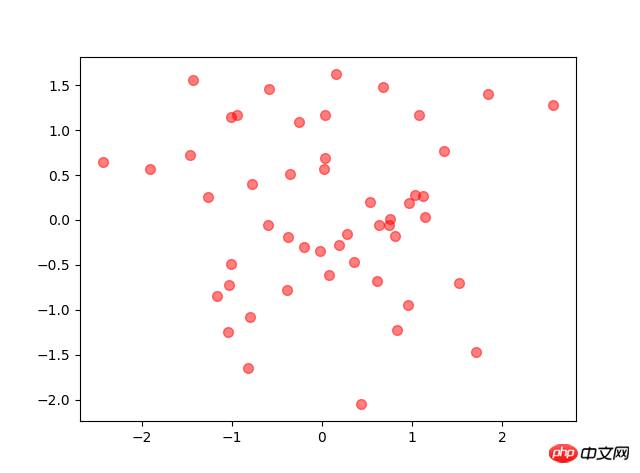
3. Streudiagrammimport numpy as npnumpy.random
rand(d0, d1, ..., dn) In [2]: x=np.random.rand(2,5)
rand(d0, d1, ..., dn) In [2]: x=np.random.rand(2,5)
In [3]: x
Out[3]:
array([[ 0.84286554, 0.50007593, 0.66500549, 0.97387807, 0.03993009],
[ 0.46391661, 0.50717355, 0.21527461, 0.92692517, 0.2567891 ]])randn(d0, d1, ..., dn)查询结果为标准正态分布
In [4]: x=np.random.randn(2,5)
In [5]: x
Out[5]:
array([[-0.77195196, 0.26651203, -0.35045793, -0.0210377 , 0.89749635],
[-0.20229338, 1.44852833, -0.10858996, -1.65034606, -0.39793635]])randint(low,high,size) 生成low到high之间(半开区间 [low, high)),size个数据
In [6]: x=np.random.randint(1,8,4)
In [7]: x
Out[7]: array([4, 4, 2, 7])random_integers(low,high,size) 生成low到high之间(闭区间 [low, high)),size个数据
In [10]: x=np.random.random_integers(2,10,5)
In [11]: x
Out[11]: array([7, 4, 5, 4, 2])In [3]: x
Out[3]:
array([[ 0.84286554, 0.50007593, 0.66500549, 0.97387807, 0.03993009],
[ 0.46391661, 0. 50717355, 0.2 1527461 , 0,92692517, 0,2567891 ]])randn(d0, d1, ..., dn) Abfrageergebnis ist Standardnormalverteilung td>
Out[5]:
array( [[-0.77195196, 0.26651203, -0.35045793, -0.0210377, 0.89749635],
[-0.20229338, 1.44852833, -0.10858996, -1.650346 06, -0. 39793635]])randint(low,high,size) Größendaten zwischen niedrig und hoch (halboffenes Intervall [niedrig, hoch)) generierenIn [ 6]: x=np.random.randint(1,8,4)
In [7]: x
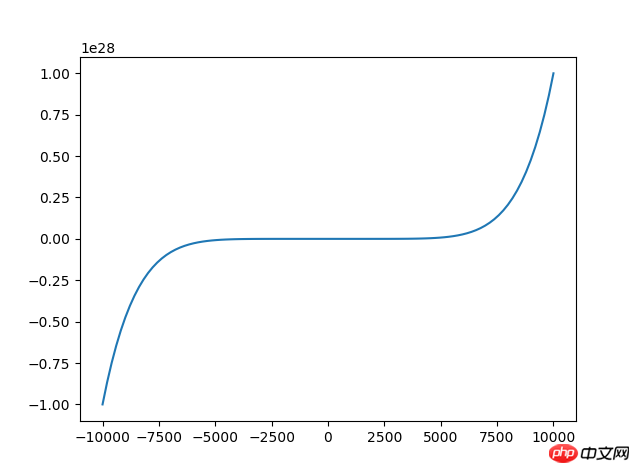
Out[7]: array([4, 4, 2 , 7])random_integers(low,high,size) Generieren Sie zwischen niedrig und hoch (geschlossenes Intervall [low, hoch)) , Größendaten <code class="language-python hljs"># 来源:百度网盘搜索 <br/>x=np.linspace(<span class="hljs-number">-10000,<span class="hljs-number">10000,<span class="hljs-number">100) <span class="hljs-comment">#将-10到10等区间分成100份 y=x**<span class="hljs-number">2+x**<span class="hljs-number">3+x**<span class="hljs-number">7 plt.plot(x,y) plt.show()</span></span></span></span></span></span></span></code>In [10]: x=np.random.random_integers(2,10,5)In [11]: x
Out[11 ]: array([7, 4, 5, 4, 2])
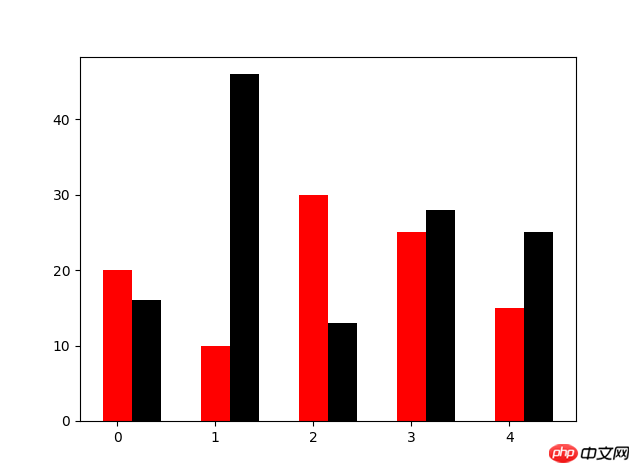
Liniendiagramm Das Diagramm verwendet die PlotfunktionN=5 y=[20,10,30,25,15] y1=np.random.randint(10,50,5) x=np.random.randint(10,1000,N) index=np.arange(N) plt.bar(left=index,height=y,color='red',width=0.3) plt.bar(left=index+0.3,height=y1,color='black',width=0.3) plt.show()4. Liniendiagramm
N=5
y=[20,10,30,25,15]
y1=np.random.randint(10,50,5)
x=np.random.randint(10,1000,N)
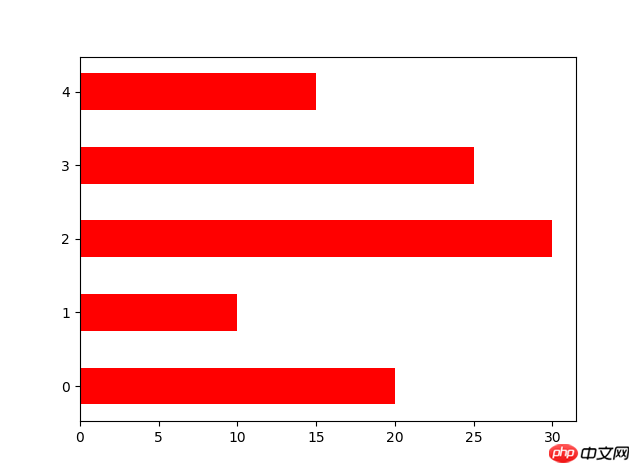
index=np.arange(N)# plt.bar(left=index,height=y,color='red',width=0.3)# plt.bar(left=index+0.3,height=y1,color='black',width=0.3)#plt.barh() 加了h就是横向的条形图,不用设置orientation
plt.bar(left=0,bottom=index,width=y,color='red',height=0.5,orientation='horizontal')
plt.show()
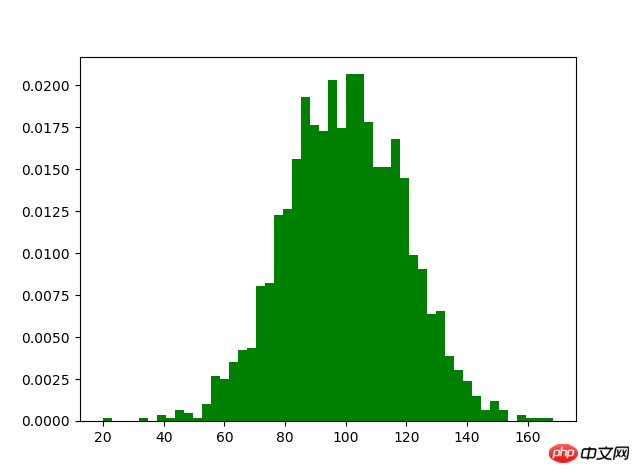
Ausrichtung legt horizontales Balkendiagramm festm1=100 sigma=20 x=m1+sigma*np.random.randn(2000) plt.hist(x,bins=50,color="green",normed=True) plt.show()5. Balkendiagramm
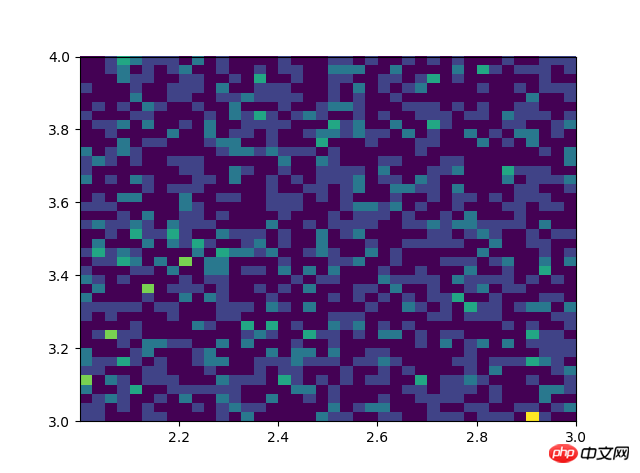
# #双变量的直方图# #颜色越深频率越高# #研究双变量的联合分布#双变量的直方图#颜色越深频率越高#研究双变量的联合分布 x=np.random.rand(1000)+2 y=np.random.rand(1000)+3 plt.hist2d(x,y,bins=40) plt.show()
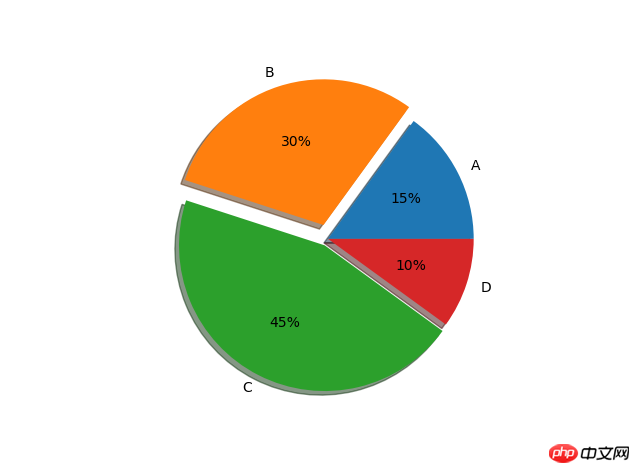
#设置x,y轴比例为1:1,从而达到一个正的圆#labels标签参数,x是对应的数据列表,autopct显示每一个区域占的比例,explode突出显示某一块,shadow阴影labes=['A','B','C','D'] fracs=[15,30,45,10] explode=[0,0.1,0.05,0]#设置x,y轴比例为1:1,从而达到一个正的圆 plt.axes(aspect=1)#labels标签参数,x是对应的数据列表,autopct显示每一个区域占的比例,explode突出显示某一块,shadow阴影 plt.pie(x=fracs,labels=labes,autopct="%.0f%%",explode=explode,shadow=True) plt.show()6. Histogramm
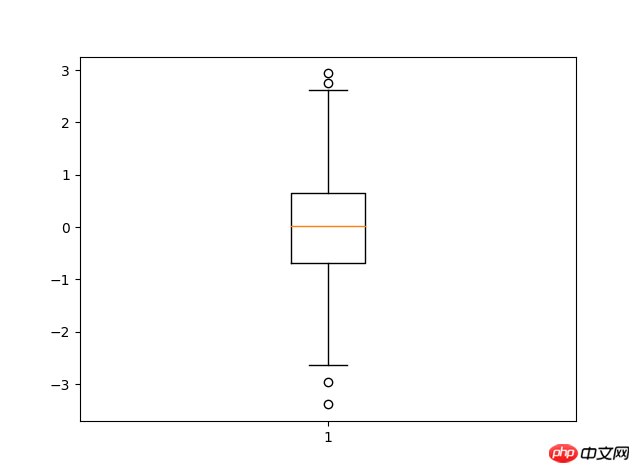
7 8. Boxplotimport matplotlib.pyplot as pltimport numpy as npdata=np.random.normal(loc=0,scale=1,size=1000)#sym 点的形状,whis虚线的长度plt.boxplot(data,sym="o",whis=1.5)plt.show()#sym 点的形状,whis虚线的长度
Das obige ist der detaillierte Inhalt vonAusführliche Erläuterung von Beispielen zum Zeichnen von Grafiken mit Python. Für weitere Informationen folgen Sie bitte anderen verwandten Artikeln auf der PHP chinesischen Website!


 Größendaten zwischen niedrig und hoch (halboffenes Intervall [niedrig, hoch)) generierenIn [ 6]: x=np.random.randint(1,8,4)