仅有的幸福2017-06-20 10:07:45
试试
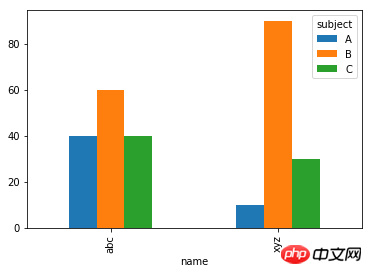
df.pivot('name', 'subject', 'score').plot.bar()
基本pandas 可视化原则是,使用pivot 或melt搞出制图需要的表格格式。
下列是我跑的代码(Jupyter Notebook)
% matplotlib inline
data = [ {"name":"abc", "subject":"A", "score":40}, {"name":"abc", "subject":"B", "score":60}, {"name":"abc", "subject":"C", "score":40},
        {"name":"xyz", "subject":"A", "score":10}, {"name":"xyz", "subject":"B", "score":90}, {"name":"xyz", "subject":"C", "score":30}]
df = pd.DataFrame(data)
df.pivot('name', 'subject', 'score').plot.bar()
结果: