


ogive图形以图形化方式表示一组数据的累积分布函数(CDF),有时也称为累积频率曲线。它用于检查数据分布并发现模式和趋势。Matplotlib、Pandas和Numpy是Python提供的一些库和工具,用于创建ogive图形。在本教程中,我们将看看如何使用Matplotlib在Python中生成ogive图形。
要创建一个累积曲线图,我们需要导入所需的库。在这个例子中,我们将使用Matplotlib,Pandas和Numpy。Matplotlib是一个流行的数据可视化库,用于在Python中创建交互式图表和图形。另一方面,Numpy用于执行复杂的数学运算。Pandas是另一个广泛使用的Python库,专门用于数据操作和分析。
语法
plt.plot(*np.histogram(data, bins), 'o-')
在这个语法中,'data'是用来创建累积曲线图的数据集。数据的频率分布由'np.histogram'函数确定,该函数还返回直方图的值和箱子边界。使用'plt.plot'创建累积曲线图,使用' 'o-' '格式字符串来绘制数据点并用线连接它们。然后,'*'运算符将直方图的值和箱子边界作为单独的参数传递给'plt.plot'。
示例
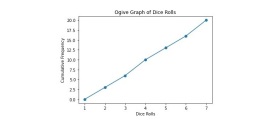
这是一个简单的示例,创建了一个 ogive 图来可视化一个骰子投掷列表的累积频率分布。
import numpy as np
import matplotlib.pyplot as plt

# List of dice rolls
rolls = [1, 2, 3, 4, 5, 6, 3, 6, 2, 5, 1, 6, 4, 2, 3, 5, 1, 4, 6, 3]

# Calculate the cumulative frequency
bins = np.arange(0, 8, 1)
freq, bins = np.histogram(rolls, bins=bins)
cumulative_freq = np.cumsum(freq)

# Create the ogive graph
plt.plot(bins[1:], cumulative_freq, '-o')
plt.xlabel('Dice Rolls')
plt.ylabel('Cumulative Frequency')
plt.title('Ogive Graph of Dice Rolls')
plt.show()
首先,我们创建了一个ogive图来可视化一组骰子掷出结果的累积频率分布,通过导入必要的模块NumPy和Matplotlib来实现。然后,代码定义了一组骰子掷出结果,并使用NumPy的直方图函数来生成数据的“直方图”,指定数据的分组数和取值范围。接下来,使用NumPy的'cumsum'函数表示数据的累积频率。
最后,使用Matplotlib的“plot”函数将累积频率绘制为对数图,其中每个箱的上限用作x轴,形成ogive图。所得的ogive图显示了骰子投掷的累积频率分布,其中x轴表示投掷的值,y轴表示这些值在某一点之前的累积频率。这个图可以用来分析骰子投掷的频率和分布。
输出
示例
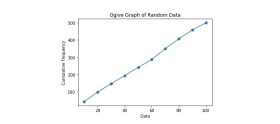
这个示例演示了一个ogive图,用于可视化0到100之间的500个随机数的分布。
import numpy as np
import matplotlib.pyplot as plt

# Generate random data
data = np.random.randint(0, 100, 500)

# Calculate the cumulative frequency
bins = np.arange(0, 110, 10)
freq, bins = np.histogram(data, bins=bins)
cumulative_freq = np.cumsum(freq)

# Create the ogive graph
plt.plot(bins[1:], cumulative_freq, '-o')
plt.xlabel('Data')
plt.ylabel('Cumulative Frequency')
plt.title('Ogive Graph of Random Data')
plt.show()
在这个例子中,我们首先使用NumPy生成一个包含500个0到100之间的随机数的数据集。然后使用NumPy计算出数据的累积频率,每个频率的区间宽度为10。最后,使用Matplotlib绘制累积频率与每个区间的上限之间的关系,生成ogive图。这个例子演示了如何使用Python和随机生成的数据创建ogive图。
输出
我们学会了使用Matplotlib模块在Python中创建累积曲线图,这是一个简单的过程,使用matplotlib库。通过加载数据、计算累积频率并绘制结果,您可以轻松地可视化数据集的分布,并识别任何模式或趋势。您可以使用标签、标题和样式自定义您的图形,使其更具视觉吸引力和信息量。累积曲线图是统计分析中有用的工具,可以表示各种数据,从收入分布到考试成绩。
以上是如何在Python中创建累积曲线图?的详细内容。更多信息请关注PHP中文网其他相关文章!

 在Python阵列上可以执行哪些常见操作?Apr 26, 2025 am 12:22 AM
Pythonarrayssupportvariousoperations:1)Slicingextractssubsets,2)Appending/Extendingaddselements,3)Insertingplaceselementsatspecificpositions,4)Removingdeleteselements,5)Sorting/Reversingchangesorder,and6)Listcomprehensionscreatenewlistsbasedonexistin
 在哪些类型的应用程序中,Numpy数组常用?Apr 26, 2025 am 12:13 AM
NumPyarraysareessentialforapplicationsrequiringefficientnumericalcomputationsanddatamanipulation.Theyarecrucialindatascience,machinelearning,physics,engineering,andfinanceduetotheirabilitytohandlelarge-scaledataefficiently.Forexample,infinancialanaly
 您什么时候选择在Python中的列表上使用数组?Apr 26, 2025 am 12:12 AM
useanArray.ArarayoveralistinpythonwhendeAlingwithHomeSdata,performance-Caliticalcode,orinterFacingWithCcccode.1)同质性data:arrayssavememorywithtypedelements.2)绩效code-performance-clitionalcode-clitadialcode-critical-clitical-clitical-clitical-clitaine code:araysofferferbetterperperperformenterperformanceformanceformancefornalumericalicalialical.3)
 所有列表操作是否由数组支持,反之亦然?为什么或为什么不呢?Apr 26, 2025 am 12:05 AM
不,notalllistoperationsareSupportedByArrays,andviceversa.1)arraysdonotsupportdynamicoperationslikeappendorinsertwithoutresizing,wheremactssperformance.2)listssdonotguaranteeconeeconeconstanttanttanttanttanttanttanttanttimecomplecomecomecomplecomecomecomecomecomecomplecomectaccesslikearrikearraysodo。
 您如何在python列表中访问元素?Apr 26, 2025 am 12:03 AM
toAccesselementsInapythonlist,useIndIndexing,负索引,切片,口头化。1)indexingStartSat0.2)否定indexingAccessesessessessesfomtheend.3)slicingextractsportions.4)iterationerationUsistorationUsisturessoreTionsforloopsoreNumeratorseforeporloopsorenumerate.alwaysCheckListListListListlentePtotoVoidToavoIndexIndexIndexIndexIndexIndExerror。
 Python的科学计算中如何使用阵列?Apr 25, 2025 am 12:28 AM
Arraysinpython,尤其是Vianumpy,ArecrucialInsCientificComputingfortheireftheireffertheireffertheirefferthe.1)Heasuedfornumerericalicerationalation,dataAnalysis和Machinelearning.2)Numpy'Simpy'Simpy'simplementIncressionSressirestrionsfasteroperoperoperationspasterationspasterationspasterationspasterationspasterationsthanpythonlists.3)inthanypythonlists.3)andAreseNableAblequick
 您如何处理同一系统上的不同Python版本?Apr 25, 2025 am 12:24 AM
你可以通过使用pyenv、venv和Anaconda来管理不同的Python版本。1)使用pyenv管理多个Python版本:安装pyenv,设置全局和本地版本。2)使用venv创建虚拟环境以隔离项目依赖。3)使用Anaconda管理数据科学项目中的Python版本。4)保留系统Python用于系统级任务。通过这些工具和策略,你可以有效地管理不同版本的Python,确保项目顺利运行。
 与标准Python阵列相比,使用Numpy数组的一些优点是什么?Apr 25, 2025 am 12:21 AM
numpyarrayshaveseveraladagesoverandastardandpythonarrays:1)基于基于duetoc的iMplation,2)2)他们的aremoremoremorymorymoremorymoremorymoremorymoremoremory,尤其是WithlargedAtasets和3)效率化,效率化,矢量化函数函数函数函数构成和稳定性构成和稳定性的操作,制造


热AI工具

Undresser.AI Undress
人工智能驱动的应用程序,用于创建逼真的裸体照片

AI Clothes Remover
用于从照片中去除衣服的在线人工智能工具。

Undress AI Tool
免费脱衣服图片

Clothoff.io
AI脱衣机

Video Face Swap
使用我们完全免费的人工智能换脸工具轻松在任何视频中换脸!

热门文章
热工具

Dreamweaver Mac版
视觉化网页开发工具

SublimeText3 Mac版
神级代码编辑软件(SublimeText3)

安全考试浏览器
Safe Exam Browser是一个安全的浏览器环境,用于安全地进行在线考试。该软件将任何计算机变成一个安全的工作站。它控制对任何实用工具的访问,并防止学生使用未经授权的资源。

EditPlus 中文破解版
体积小,语法高亮,不支持代码提示功能

PhpStorm Mac 版本
最新(2018.2.1 )专业的PHP集成开发工具

