


zabbix监控nginx
a机器:zabbix服务端(192.168.234.128) b机器:zabbix客户端(192.168.234.125)
在b机器(zabbix客户端)操作:
编辑nginx虚拟主机配置文件:
[root@centos ~]# vi /etc/nginx/conf.d/default.conf
在server{}中添加以下内容:
 location /nginx_status
 {
  stub_status on;
  access_log off;
  allow 127.0.0.1;
  deny all;
 }
重载nginx配置:
[root@centos ~]# nginx -s reload
测试:
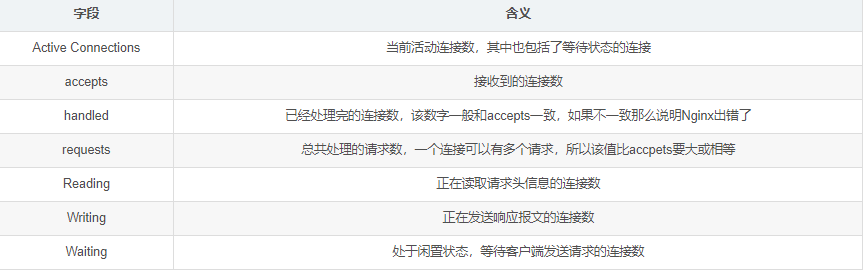
[root@centos ~]# curl http://127.0.0.1/nginx_status
active connections: 1
server accepts handled requests
 3 3 3
reading: 0 writing: 1 waiting: 0
#nginx状态信息已显示
状态说明:
添加监控脚本:
vi /usr/local/sbin/ngx_status.sh
添加以下内容:
#!/bin/bash
url="http://127.0.0.1/nginx_status"
curl=/usr/bin/curl

# 检测nginx进程是否存在
function ping {
 /sbin/pidof nginx | wc -l
}
# 检测nginx性能
function active {
 $curl $url 2>/dev/null| grep 'active' | awk '{print $nf}'
}
function reading {
 $curl $url 2>/dev/null| grep 'reading' | awk '{print $2}'
}
function writing {
 $curl $url 2>/dev/null| grep 'writing' | awk '{print $4}'
}
function waiting {
 $curl $url 2>/dev/null| grep 'waiting' | awk '{print $6}'
}
function accepts {
 $curl $url 2>/dev/null| awk nr==3 | awk '{print $1}'
}
function handled {
 $curl $url 2>/dev/null| awk nr==3 | awk '{print $2}'
}
function requests {
 $curl $url 2>/dev/null| awk nr==3 | awk '{print $3}'
}
$1
添加权限:
[root@centos ~]# chmod 755 /usr/local/sbin/ngx_status.sh
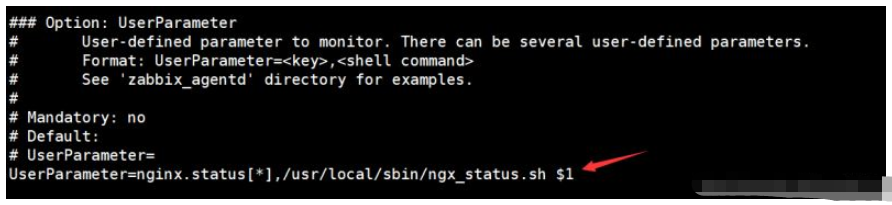
编辑zabbix_agent配置文件:
[root@centos ~]# vi /etc/zabbix/zabbix_agentd.conf
在option:userparameter处添加:userparameter=nginx.status[*],/usr/local/sbin/ngx_status.sh $1
重启服务:
[root@centos ~]# systemctl restart zabbix-agent
在a机器(服务端)测试:
[root@zabbix ~]# zabbix_get -s 192.168.234.125 -k 'nginx.status[accepts]'
6
在本机创建.xml文件并添加以下内容:(文件名称自定义)
<?xml version="1.0" encoding="utf-8"?>
<zabbix_export>
 <version>4.0</version>
 <date>2019-02-11t07:29:29z</date>
 <groups>
  <group>
   <name>templates</name>
  </group>
 </groups>
 <templates>
  <template>
   <template>template app nginx</template>
   <name>template app nginx</name>
   <description/>
   <groups>
    <group>
     <name>templates</name>
    </group>
   </groups>
   <applications>
    <application>
     <name>nginx</name>
    </application>
   </applications>
   <items>
    <item>
     <name>nginx status server accepts</name>
     <type>0</type>
     <snmp_community/>
     <snmp_oid/>
     <key>nginx.status[accepts]</key>
     <delay>60</delay>
     <history>90d</history>
     <trends>365d</trends>
     <status>0</status>
     <value_type>3</value_type>
     <allowed_hosts/>
     <units/>
     <snmpv3_contextname/>
     <snmpv3_securityname/>
     <snmpv3_securitylevel>0</snmpv3_securitylevel>
     <snmpv3_authprotocol>0</snmpv3_authprotocol>
     <snmpv3_authpassphrase/>
     <snmpv3_privprotocol>0</snmpv3_privprotocol>
     <snmpv3_privpassphrase/>
     <params/>
     <ipmi_sensor/>
     <authtype>0</authtype>
     <username/>
     <password/>
     <publickey/>
     <privatekey/>
     <port/>
     <description>accepts</description>
     <inventory_link>0</inventory_link>
     <applications>
      <application>
       <name>nginx</name>
      </application>
     </applications>
     <valuemap/>
     <logtimefmt/>
     <preprocessing>
      <step>
       <type>10</type>
       <params/>
      </step>
     </preprocessing>
     <jmx_endpoint/>
     <timeout>3s</timeout>
     <url/>
     <query_fields/>
     <posts/>
     <status_codes>200</status_codes>
     <follow_redirects>1</follow_redirects>
     <post_type>0</post_type>
     <http_proxy/>
     <headers/>
     <retrieve_mode>0</retrieve_mode>
     <request_method>0</request_method>
     <output_format>0</output_format>
     <allow_traps>0</allow_traps>
     <ssl_cert_file/>
     <ssl_key_file/>
     <ssl_key_password/>
     <verify_peer>0</verify_peer>
     <verify_host>0</verify_host>
     <master_item/>
    </item>
    <item>
     <name>nginx status connections active</name>
     <type>0</type>
     <snmp_community/>
     <snmp_oid/>
     <key>nginx.status[active]</key>
     <delay>60</delay>
     <history>90d</history>
     <trends>365d</trends>
     <status>0</status>
     <value_type>3</value_type>
     <allowed_hosts/>
     <units/>
     <snmpv3_contextname/>
     <snmpv3_securityname/>
     <snmpv3_securitylevel>0</snmpv3_securitylevel>
     <snmpv3_authprotocol>0</snmpv3_authprotocol>
     <snmpv3_authpassphrase/>
     <snmpv3_privprotocol>0</snmpv3_privprotocol>
     <snmpv3_privpassphrase/>
     <params/>
     <ipmi_sensor/>
     <authtype>0</authtype>
     <username/>
     <password/>
     <publickey/>
     <privatekey/>
     <port/>
     <description>active</description>
     <inventory_link>0</inventory_link>
     <applications>
      <application>
       <name>nginx</name>
      </application>
     </applications>
     <valuemap/>
     <logtimefmt/>
     <preprocessing/>
     <jmx_endpoint/>
     <timeout>3s</timeout>
     <url/>
     <query_fields/>
     <posts/>
     <status_codes>200</status_codes>
     <follow_redirects>1</follow_redirects>
     <post_type>0</post_type>
     <http_proxy/>
     <headers/>
     <retrieve_mode>0</retrieve_mode>
     <request_method>0</request_method>
     <output_format>0</output_format>
     <allow_traps>0</allow_traps>
     <ssl_cert_file/>
     <ssl_key_file/>
     <ssl_key_password/>
     <verify_peer>0</verify_peer>
     <verify_host>0</verify_host>
     <master_item/>
    </item>
    <item>
     <name>nginx status server handled</name>
     <type>0</type>
     <snmp_community/>
     <snmp_oid/>
     <key>nginx.status[handled]</key>
     <delay>60</delay>
     <history>90d</history>
     <trends>365d</trends>
     <status>0</status>
     <value_type>3</value_type>
     <allowed_hosts/>
     <units/>
     <snmpv3_contextname/>
     <snmpv3_securityname/>
     <snmpv3_securitylevel>0</snmpv3_securitylevel>
     <snmpv3_authprotocol>0</snmpv3_authprotocol>
     <snmpv3_authpassphrase/>
     <snmpv3_privprotocol>0</snmpv3_privprotocol>
     <snmpv3_privpassphrase/>
     <params/>
     <ipmi_sensor/>
     <authtype>0</authtype>
     <username/>
     <password/>
     <publickey/>
     <privatekey/>
     <port/>
     <description>handled</description>
     <inventory_link>0</inventory_link>
     <applications>
      <application>
       <name>nginx</name>
      </application>
     </applications>
     <valuemap/>
     <logtimefmt/>
     <preprocessing>
      <step>
       <type>10</type>
       <params/>
      </step>
     </preprocessing>
     <jmx_endpoint/>
     <timeout>3s</timeout>
     <url/>
     <query_fields/>
     <posts/>
     <status_codes>200</status_codes>
     <follow_redirects>1</follow_redirects>
     <post_type>0</post_type>
     <http_proxy/>
     <headers/>
     <retrieve_mode>0</retrieve_mode>
     <request_method>0</request_method>
     <output_format>0</output_format>
     <allow_traps>0</allow_traps>
     <ssl_cert_file/>
     <ssl_key_file/>
     <ssl_key_password/>
     <verify_peer>0</verify_peer>
     <verify_host>0</verify_host>
     <master_item/>
    </item>
    <item>
     <name>nginx status ping</name>
     <type>0</type>
     <snmp_community/>
     <snmp_oid/>
     <key>nginx.status[ping]</key>
     <delay>60</delay>
     <history>30d</history>
     <trends>365d</trends>
     <status>0</status>
     <value_type>3</value_type>
     <allowed_hosts/>
     <units/>
     <snmpv3_contextname/>
     <snmpv3_securityname/>
     <snmpv3_securitylevel>0</snmpv3_securitylevel>
     <snmpv3_authprotocol>0</snmpv3_authprotocol>
     <snmpv3_authpassphrase/>
     <snmpv3_privprotocol>0</snmpv3_privprotocol>
     <snmpv3_privpassphrase/>
     <params/>
     <ipmi_sensor/>
     <authtype>0</authtype>
     <username/>
     <password/>
     <publickey/>
     <privatekey/>
     <port/>
     <description>is live</description>
     <inventory_link>0</inventory_link>
     <applications>
      <application>
       <name>nginx</name>
      </application>
     </applications>
     <valuemap>
      <name>service state</name>
     </valuemap>
     <logtimefmt/>
     <preprocessing/>
     <jmx_endpoint/>
     <timeout>3s</timeout>
     <url/>
     <query_fields/>
     <posts/>
     <status_codes>200</status_codes>
     <follow_redirects>1</follow_redirects>
     <post_type>0</post_type>
     <http_proxy/>
     <headers/>
     <retrieve_mode>0</retrieve_mode>
     <request_method>0</request_method>
     <output_format>0</output_format>
     <allow_traps>0</allow_traps>
     <ssl_cert_file/>
     <ssl_key_file/>
     <ssl_key_password/>
     <verify_peer>0</verify_peer>
     <verify_host>0</verify_host>
     <master_item/>
    </item>
    <item>
     <name>nginx status connections reading</name>
     <type>0</type>
     <snmp_community/>
     <snmp_oid/>
     <key>nginx.status[reading]</key>
     <delay>60</delay>
     <history>90d</history>
     <trends>365d</trends>
     <status>0</status>
     <value_type>3</value_type>
     <allowed_hosts/>
     <units/>
     <snmpv3_contextname/>
     <snmpv3_securityname/>
     <snmpv3_securitylevel>0</snmpv3_securitylevel>
     <snmpv3_authprotocol>0</snmpv3_authprotocol>
     <snmpv3_authpassphrase/>
     <snmpv3_privprotocol>0</snmpv3_privprotocol>
     <snmpv3_privpassphrase/>
     <params/>
     <ipmi_sensor/>
     <authtype>0</authtype>
     <username/>
     <password/>
     <publickey/>
     <privatekey/>
     <port/>
     <description>reading</description>
     <inventory_link>0</inventory_link>
     <applications>
      <application>
       <name>nginx</name>
      </application>
     </applications>
     <valuemap/>
     <logtimefmt/>
     <preprocessing/>
     <jmx_endpoint/>
     <timeout>3s</timeout>
     <url/>
     <query_fields/>
     <posts/>
     <status_codes>200</status_codes>
     <follow_redirects>1</follow_redirects>
     <post_type>0</post_type>
     <http_proxy/>
     <headers/>
     <retrieve_mode>0</retrieve_mode>
     <request_method>0</request_method>
     <output_format>0</output_format>
     <allow_traps>0</allow_traps>
     <ssl_cert_file/>
     <ssl_key_file/>
     <ssl_key_password/>
     <verify_peer>0</verify_peer>
     <verify_host>0</verify_host>
     <master_item/>
    </item>
    <item>
     <name>nginx status server requests</name>
     <type>0</type>
     <snmp_community/>
     <snmp_oid/>
     <key>nginx.status[requests]</key>
     <delay>60</delay>
     <history>90d</history>
     <trends>365d</trends>
     <status>0</status>
     <value_type>3</value_type>
     <allowed_hosts/>
     <units/>
     <snmpv3_contextname/>
     <snmpv3_securityname/>
     <snmpv3_securitylevel>0</snmpv3_securitylevel>
     <snmpv3_authprotocol>0</snmpv3_authprotocol>
     <snmpv3_authpassphrase/>
     <snmpv3_privprotocol>0</snmpv3_privprotocol>
     <snmpv3_privpassphrase/>
     <params/>
     <ipmi_sensor/>
     <authtype>0</authtype>
     <username/>
     <password/>
     <publickey/>
     <privatekey/>
     <port/>
     <description>requests</description>
     <inventory_link>0</inventory_link>
     <applications>
      <application>
       <name>nginx</name>
      </application>
     </applications>
     <valuemap/>
     <logtimefmt/>
     <preprocessing>
      <step>
       <type>10</type>
       <params/>
      </step>
     </preprocessing>
     <jmx_endpoint/>
     <timeout>3s</timeout>
     <url/>
     <query_fields/>
     <posts/>
     <status_codes>200</status_codes>
     <follow_redirects>1</follow_redirects>
     <post_type>0</post_type>
     <http_proxy/>
     <headers/>
     <retrieve_mode>0</retrieve_mode>
     <request_method>0</request_method>
     <output_format>0</output_format>
     <allow_traps>0</allow_traps>
     <ssl_cert_file/>
     <ssl_key_file/>
     <ssl_key_password/>
     <verify_peer>0</verify_peer>
     <verify_host>0</verify_host>
     <master_item/>
    </item>
    <item>
     <name>nginx status connections waiting</name>
     <type>0</type>
     <snmp_community/>
     <snmp_oid/>
     <key>nginx.status[waiting]</key>
     <delay>60</delay>
     <history>90d</history>
     <trends>365d</trends>
     <status>0</status>
     <value_type>3</value_type>
     <allowed_hosts/>
     <units/>
     <snmpv3_contextname/>
     <snmpv3_securityname/>
     <snmpv3_securitylevel>0</snmpv3_securitylevel>
     <snmpv3_authprotocol>0</snmpv3_authprotocol>
     <snmpv3_authpassphrase/>
     <snmpv3_privprotocol>0</snmpv3_privprotocol>
     <snmpv3_privpassphrase/>
     <params/>
     <ipmi_sensor/>
     <authtype>0</authtype>
     <username/>
     <password/>
     <publickey/>
     <privatekey/>
     <port/>
     <description>waiting</description>
     <inventory_link>0</inventory_link>
     <applications>
      <application>
       <name>nginx</name>
      </application>
     </applications>
     <valuemap/>
     <logtimefmt/>
     <preprocessing/>
     <jmx_endpoint/>
     <timeout>3s</timeout>
     <url/>
     <query_fields/>
     <posts/>
     <status_codes>200</status_codes>
     <follow_redirects>1</follow_redirects>
     <post_type>0</post_type>
     <http_proxy/>
     <headers/>
     <retrieve_mode>0</retrieve_mode>
     <request_method>0</request_method>
     <output_format>0</output_format>
     <allow_traps>0</allow_traps>
     <ssl_cert_file/>
     <ssl_key_file/>
     <ssl_key_password/>
     <verify_peer>0</verify_peer>
     <verify_host>0</verify_host>
     <master_item/>
    </item>
    <item>
     <name>nginx status connections writing</name>
     <type>0</type>
     <snmp_community/>
     <snmp_oid/>
     <key>nginx.status[writing]</key>
     <delay>60</delay>
     <history>90d</history>
     <trends>365d</trends>
     <status>0</status>
     <value_type>3</value_type>
     <allowed_hosts/>
     <units/>
     <snmpv3_contextname/>
     <snmpv3_securityname/>
     <snmpv3_securitylevel>0</snmpv3_securitylevel>
     <snmpv3_authprotocol>0</snmpv3_authprotocol>
     <snmpv3_authpassphrase/>
     <snmpv3_privprotocol>0</snmpv3_privprotocol>
     <snmpv3_privpassphrase/>
     <params/>
     <ipmi_sensor/>
     <authtype>0</authtype>
     <username/>
     <password/>
     <publickey/>
     <privatekey/>
     <port/>
     <description>writing</description>
     <inventory_link>0</inventory_link>
     <applications>
      <application>
       <name>nginx</name>
      </application>
     </applications>
     <valuemap/>
     <logtimefmt/>
     <preprocessing/>
     <jmx_endpoint/>
     <timeout>3s</timeout>
     <url/>
     <query_fields/>
     <posts/>
     <status_codes>200</status_codes>
     <follow_redirects>1</follow_redirects>
     <post_type>0</post_type>
     <http_proxy/>
     <headers/>
     <retrieve_mode>0</retrieve_mode>
     <request_method>0</request_method>
     <output_format>0</output_format>
     <allow_traps>0</allow_traps>
     <ssl_cert_file/>
     <ssl_key_file/>
     <ssl_key_password/>
     <verify_peer>0</verify_peer>
     <verify_host>0</verify_host>
     <master_item/>
    </item>
   </items>
   <discovery_rules/>
   <httptests/>
   <macros/>
   <templates/>
   <screens/>
  </template>
 </templates>
 <triggers>
  <trigger>
   <expression>{template app nginx:nginx.status[ping].last()}=0</expression>
   <recovery_mode>0</recovery_mode>
   <recovery_expression/>
   <name>nginx was down!</name>
   <correlation_mode>0</correlation_mode>
   <correlation_tag/>
   <url/>
   <status>0</status>
   <priority>4</priority>
   <description>nginx进程数:0,请注意</description>
   <type>0</type>
   <manual_close>0</manual_close>
   <dependencies/>
   <tags/>
  </trigger>
 </triggers>
 <graphs>
  <graph>
   <name>nginx status connections</name>
   <width>900</width>
   <height>200</height>
   <yaxismin>0.0000</yaxismin>
   <yaxismax>100.0000</yaxismax>
   <show_work_period>1</show_work_period>
   <show_triggers>1</show_triggers>
   <type>0</type>
   <show_legend>1</show_legend>
   <show_3d>0</show_3d>
   <percent_left>0.0000</percent_left>
   <percent_right>0.0000</percent_right>
   <ymin_type_1>0</ymin_type_1>
   <ymax_type_1>0</ymax_type_1>
   <ymin_item_1>0</ymin_item_1>
   <ymax_item_1>0</ymax_item_1>
   <graph_items>
    <graph_item>
     <sortorder>0</sortorder>
     <drawtype>0</drawtype>
     <color>00c800</color>
     <yaxisside>0</yaxisside>
     <calc_fnc>2</calc_fnc>
     <type>0</type>
     <item>
      <host>template app nginx</host>
      <key>nginx.status[active]</key>
     </item>
    </graph_item>
    <graph_item>
     <sortorder>1</sortorder>
     <drawtype>0</drawtype>
     <color>c80000</color>
     <yaxisside>0</yaxisside>
     <calc_fnc>2</calc_fnc>
     <type>0</type>
     <item>
      <host>template app nginx</host>
      <key>nginx.status[reading]</key>
     </item>
    </graph_item>
    <graph_item>
     <sortorder>2</sortorder>
     <drawtype>0</drawtype>
     <color>0000c8</color>
     <yaxisside>0</yaxisside>
     <calc_fnc>2</calc_fnc>
     <type>0</type>
     <item>
      <host>template app nginx</host>
      <key>nginx.status[waiting]</key>
     </item>
    </graph_item>
    <graph_item>
     <sortorder>3</sortorder>
     <drawtype>0</drawtype>
     <color>c800c8</color>
     <yaxisside>0</yaxisside>
     <calc_fnc>2</calc_fnc>
     <type>0</type>
     <item>
      <host>template app nginx</host>
      <key>nginx.status[writing]</key>
     </item>
    </graph_item>
   </graph_items>
  </graph>
  <graph>
   <name>nginx status server</name>
   <width>900</width>
   <height>200</height>
   <yaxismin>0.0000</yaxismin>
   <yaxismax>100.0000</yaxismax>
   <show_work_period>1</show_work_period>
   <show_triggers>1</show_triggers>
   <type>0</type>
   <show_legend>1</show_legend>
   <show_3d>0</show_3d>
   <percent_left>0.0000</percent_left>
   <percent_right>0.0000</percent_right>
   <ymin_type_1>0</ymin_type_1>
   <ymax_type_1>0</ymax_type_1>
   <ymin_item_1>0</ymin_item_1>
   <ymax_item_1>0</ymax_item_1>
   <graph_items>
    <graph_item>
     <sortorder>0</sortorder>
     <drawtype>0</drawtype>
     <color>00c800</color>
     <yaxisside>0</yaxisside>
     <calc_fnc>2</calc_fnc>
     <type>0</type>
     <item>
      <host>template app nginx</host>
      <key>nginx.status[accepts]</key>
     </item>
    </graph_item>
    <graph_item>
     <sortorder>1</sortorder>
     <drawtype>0</drawtype>
     <color>c80000</color>
     <yaxisside>0</yaxisside>
     <calc_fnc>2</calc_fnc>
     <type>0</type>
     <item>
      <host>template app nginx</host>
      <key>nginx.status[handled]</key>
     </item>
    </graph_item>
    <graph_item>
     <sortorder>2</sortorder>
     <drawtype>0</drawtype>
     <color>0000c8</color>
     <yaxisside>0</yaxisside>
     <calc_fnc>2</calc_fnc>
     <type>0</type>
     <item>
      <host>template app nginx</host>
      <key>nginx.status[requests]</key>
     </item>
    </graph_item>
   </graph_items>
  </graph>
 </graphs>
 <value_maps>
  <value_map>
   <name>service state</name>
   <mappings>
    <mapping>
     <value>0</value>
     <newvalue>down</newvalue>
    </mapping>
    <mapping>
     <value>1</value>
     <newvalue>up</newvalue>
    </mapping>
   </mappings>
  </value_map>
 </value_maps>
</zabbix_export>
在zabbix前端页面点击配置→模板→导入:
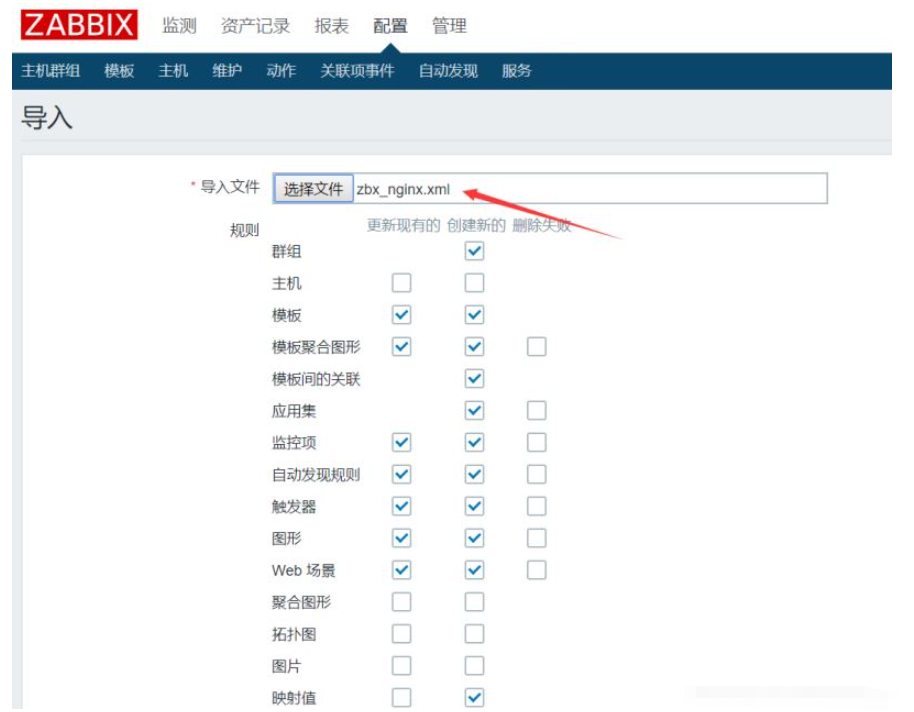
#导入刚才创建的xml文件即可
导入成功后在主机列表页面选择被监控的机器(b机器)链接该模板即可开始监控nginx
zabbix监控tomcat
a机器:zabbix服务端(192.168.234.128) b机器:zabbix客户端(192.168.234.125)
在a机器安装zabbix-java-gateway:
[root@zabbix ~]# wget https://mirrors.tuna.tsinghua.edu.cn/zabbix/zabbix/4.0/rhel/7/x86_64/zabbix-java-gateway-4.0.14-1.el7.x86_64.rpm

[root@zabbix ~]# yum -y localinstall zabbix-java-gateway-4.0.14-1.el7.x86_64.rpm
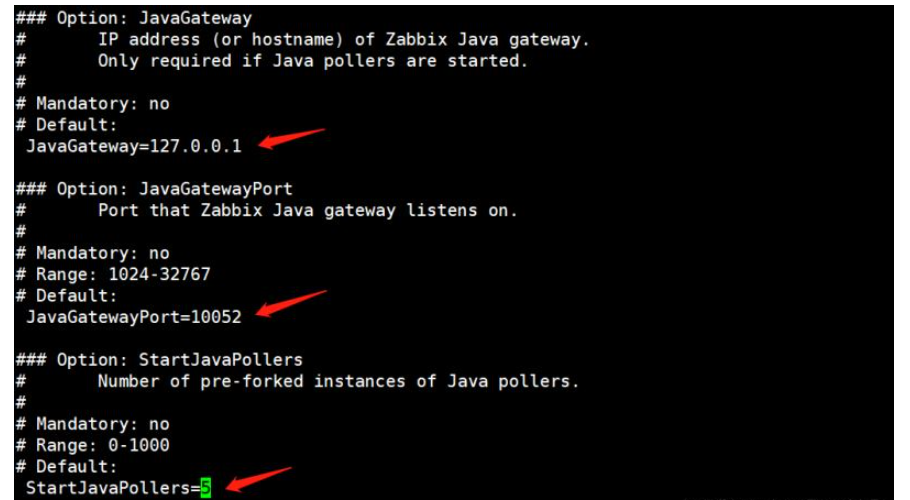
编辑gateway配置文件:
[root@zabbix ~]# vi /etc/zabbix/zabbix_java_gateway.conf
去掉listen_ip、listen_port(监听端口)、start_pollers(进程数)的注释符号#:
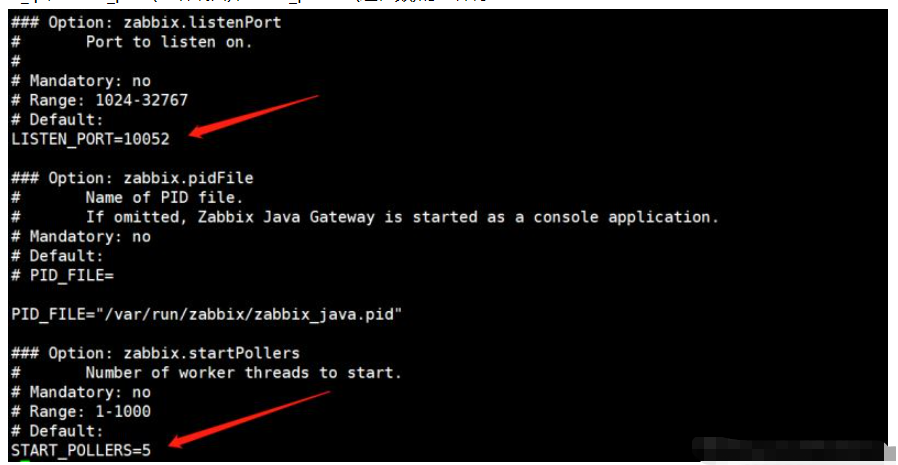
#listen_ip定义被监控机器的地址,不指定默认监听全部机器
编辑server配置文件:
[root@zabbix ~]# vi /etc/zabbix/zabbix_server.conf
定义以下3个配置参数:
启动zabbix-java-gateway服务:
[root@zabbix ~]# systemctl start zabbix-java-gateway
重启zabbix-server服务:
[root@zabbix ~]# systemctl restart zabbix-server
查看监听端口:
[root@zabbix ~]# netstat -lntp |grep java
tcp6  0  0 :::10052    :::*     listen  8706/java
开启jmx
在b机器编辑tomcat配置文件:
[root@centos ~]# vi /usr/local/tomcat/bin/catalina.sh
添加以下内容:
export catalina_opts="$catalina_opts -dcom.sun.management.jmxremote
-djava.rmi.server.hostname=192.168.234.125
-dcom.sun.management.jmxremote.port=9999
-dcom.sun.management.jmxremote.ssl=false
-dcom.sun.management.jmxremote.authenticate=false"
#hostname定义b机器地址,端口9999(默认12345)
重启tomcat:
[root@centos ~]# /usr/local/tomcat/bin/shutdown.sh

[root@centos ~]# /usr/local/tomcat/bin/startup.sh
查看监听端口9999:
[root@centos ~]# netstat -lntp |grep 9999
tcp6  0  0 :::9999     :::*     listen  25861/java
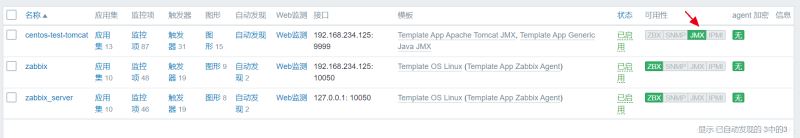
进入zabbix前端页面添加主机:

#与普通情况添加监控主机不同,监控b机器的tomcat需要配置jmx接口
模板链接jmx相关的两个模板:

当jmx图标变绿即表示配置成功:
zabbix监控mysql
a机器:zabbix服务端(192.168.234.128) b机器:zabbix客户端(192.168.234.125)
zabbix_agent定义mysql监控的配置文件:/etc/zabbix/zabbix_agentd.d/userparameter_mysql.conf
在b机器登录mysql创建用户:
mysql> grant usage,process,replication client on *.* to zamysql@'localhost' identified by 'zamysql';
创建配置文件指定的目录:
[root@centos ~]# mkdir /var/lib/zabbix
创建my.cnf文件:
[root@centos ~]# vi /var/lib/zabbix/.my.cnf
#需要注意该文件是隐藏文件
添加以下内容:
[mysql]
host=localhost
user=zamysql
password='zamysql'
socket=/tmp/mysql.sock

[mysqladmin]
host=localhost
user=zamysql
password='zamysql'
socket=/tmp/mysql.sock
在a机器测试:
[root@zabbix ~]# zabbix_get -s 192.168.234.125 -p 10050 -k mysql.ping
1
[root@zabbix ~]# zabbix_get -s 192.168.234.125 -p 10050 -k mysql.version
mysql ver 14.14 distrib 5.6.43, for linux-glibc2.12 (x86_64) using editline wrapper
[root@zabbix ~]# zabbix_get -s 192.168.234.125 -p 10050 -k mysql.size
10240
#已成功获取数据
在zabbix前端页面添加主机:
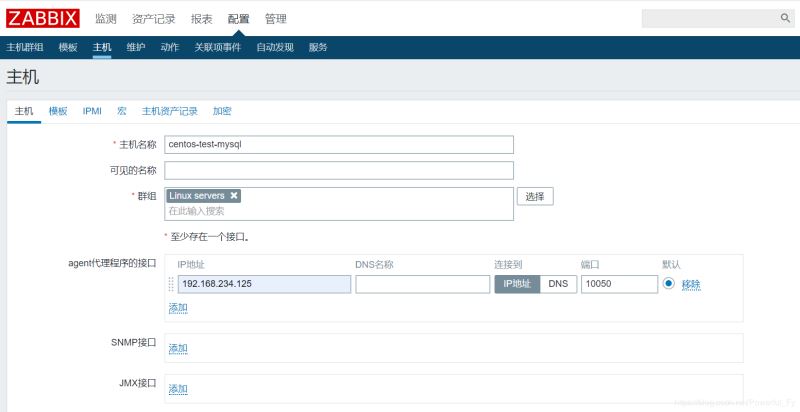
监控模板选择db mysql:

zbx标准变为绿色表示成功:
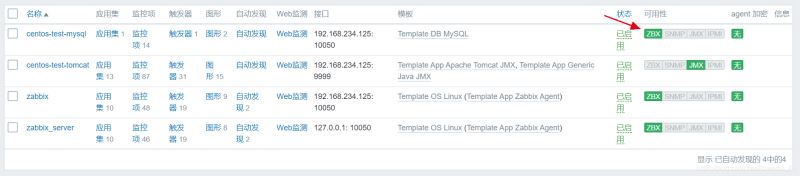
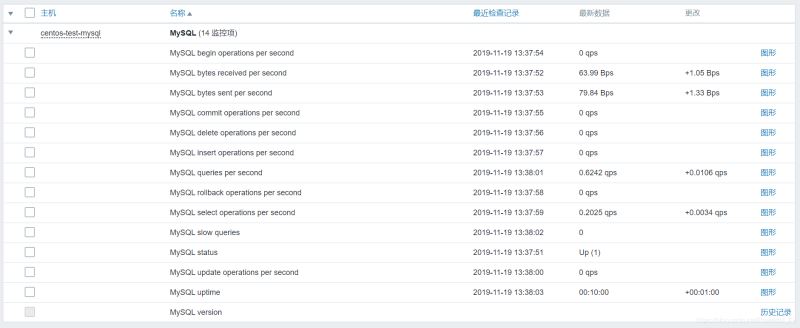
在监测→最新数据页面即可查看mysql监控数据:
以上是zabbix监控Nginx/Tomcat/MySQL的方法的详细内容。更多信息请关注PHP中文网其他相关文章!

 NGINX的优点:速度,效率和控制May 12, 2025 am 12:13 AM
NGINX受欢迎的原因是其在速度、效率和控制方面的优势。1)速度:采用异步、非阻塞处理,支持高并发连接,静态文件服务能力强。2)效率:内存使用低,负载均衡功能强大。3)控制:通过灵活的配置文件管理行为,模块化设计便于扩展。
 NGINX与Apache:社区,支持和资源May 11, 2025 am 12:19 AM
NGINX和Apache在社区、支持和资源方面的差异如下:1.NGINX的社区虽然规模较小,但活跃度和专业性高,官方支持通过NGINXPlus提供高级功能和专业服务。2.Apache拥有庞大且活跃的社区,官方支持主要通过丰富的文档和社区资源提供。
 NGINX单元:应用程序服务器简介May 10, 2025 am 12:17 AM
NGINXUnit是一个开源的应用服务器,支持多种编程语言和框架,如Python、PHP、Java、Go等。1.它支持动态配置,可以在不重启服务器的情况下调整应用配置。2.NGINXUnit支持多语言应用,简化了多语言环境的管理。3.通过配置文件,可以轻松部署和管理应用,如运行Python和PHP应用。4.它还支持高级配置,如路由和负载均衡,帮助管理和扩展应用。
 使用NGINX:优化网站性能和可靠性May 09, 2025 am 12:19 AM
NGINX可通过以下方式提升网站性能和可靠性:1.作为Web服务器处理静态内容;2.作为反向代理服务器转发请求;3.作为负载均衡器分配请求;4.作为缓存服务器减轻后端压力。通过配置优化如启用Gzip压缩和调整连接池,NGINX能显着提高网站性能。
 NGINX的目的:服务Web内容等May 08, 2025 am 12:07 AM
nginxserveswebcontentandactsasareverseproxy,loadBalancer和more.1)效率高效的servesstaticContentLikeHtmlandImages.2)itfunctionsasareverseproxybalancer,and andginxenhanceperforfforfforfforfforfforffrenfcaching.4)
 NGINX单元:简化应用程序部署May 07, 2025 am 12:08 AM
NGINXUnit通过动态配置和多语言支持简化应用部署。1)动态配置无需重启服务器即可修改。2)支持多种编程语言,如Python、PHP、Java。3)采用异步非阻塞I/O模型,提升高并发处理性能。
 NGINX的影响:Web服务器及其他May 06, 2025 am 12:05 AM
NGINX起初解决C10K问题,现已发展为处理负载均衡、反向代理和API网关的全能选手。1)它以事件驱动和非阻塞架构闻名,适合高并发。2)NGINX可作为HTTP和反向代理服务器,支持IMAP/POP3。3)其工作原理基于事件驱动和异步I/O模型,提升了性能。4)基本用法包括配置虚拟主机和负载均衡,高级用法涉及复杂负载均衡和缓存策略。5)常见错误包括配置语法错误和权限问题,调试技巧包括使用nginx-t命令和stub_status模块。6)性能优化建议包括调整worker参数、使用gzip压缩和
 NGINX故障排除:诊断和解决常见错误May 05, 2025 am 12:09 AM
Nginx常见错误的诊断与解决方法包括:1.查看日志文件,2.调整配置文件,3.优化性能。通过分析日志、调整超时设置和优化缓存及负载均衡,可以有效解决404、502、504等错误,提高网站稳定性和性能。


热AI工具

Undresser.AI Undress
人工智能驱动的应用程序,用于创建逼真的裸体照片

AI Clothes Remover
用于从照片中去除衣服的在线人工智能工具。

Undress AI Tool
免费脱衣服图片

Clothoff.io
AI脱衣机

Video Face Swap
使用我们完全免费的人工智能换脸工具轻松在任何视频中换脸!

热门文章
热工具

SublimeText3 英文版
推荐:为Win版本,支持代码提示!

EditPlus 中文破解版
体积小,语法高亮,不支持代码提示功能

VSCode Windows 64位 下载
微软推出的免费、功能强大的一款IDE编辑器

Dreamweaver Mac版
视觉化网页开发工具

Atom编辑器mac版下载
最流行的的开源编辑器

