这篇文章主要介绍了Python使用add_subplot与subplot画子图操作,涉及Python使用matplotlib模块进行图形绘制的相关操作技巧,需要的朋友可以参考下
本文实例讲述了Python使用add_subplot与subplot画子图操作。分享给大家供大家参考,具体如下:
子图:就是在一张figure里面生成多张子图。
Matplotlib对象简介
FigureCanvas 画布
Figure 图
Axes 坐标轴(实际画图的地方)

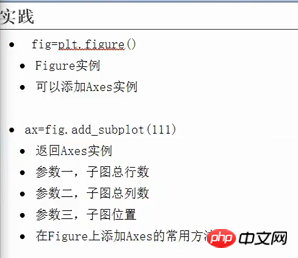
注意,pyplot的方式中plt.subplot()参数和面向对象中的add_subplot()参数和含义都相同。
使用面向对象的方式
#!/usr/bin/python
#coding: utf-8
import numpy as np
import matplotlib.pyplot as plt
x = np.arange(0, 100)
fig = plt.figure()
ax1 = fig.add_subplot(221)
ax1.plot(x, x)
ax2 = fig.add_subplot(222)
ax2.plot(x, -x)
ax3 = fig.add_subplot(223)
ax3.plot(x, x ** 2)
ax4 = fig.add_subplot(224)
ax4.plot(x, np.log(x))
plt.show()
pyplot的方式
#!/usr/bin/python
#coding: utf-8
import numpy as np
import matplotlib.pyplot as plt
x = np.arange(0, 100)
plt.subplot(221)
plt.plot(x, x)
plt.subplot(222)
plt.plot(x, -x)
plt.subplot(223)
plt.plot(x, x ** 2)
plt.subplot(224)
plt.plot(x, np.log(x))
plt.show()
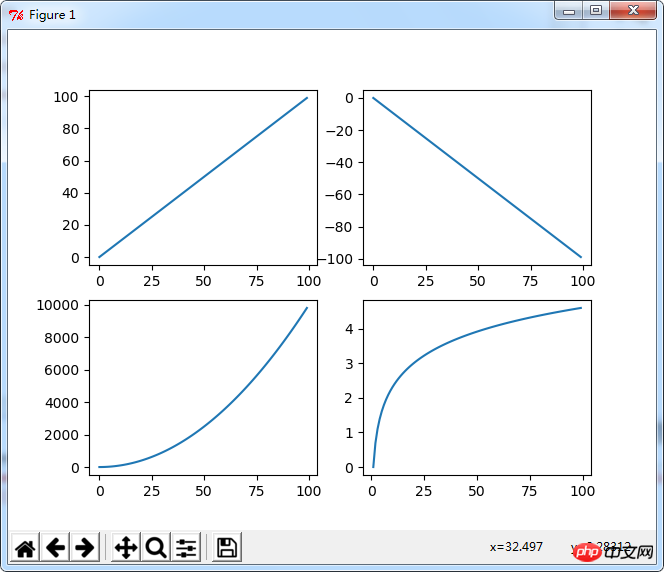
运行结果:

相关推荐:
以上是Python使用add_subplot与subplot画子图操作的详细内容。更多信息请关注PHP中文网其他相关文章!
 可以在Python数组中存储哪些数据类型?Apr 27, 2025 am 12:11 AM
pythonlistscanStoryDatatepe,ArrayModulearRaysStoreOneType,and numpyArraySareSareAraysareSareAraysareSareComputations.1)列出sareversArversAtileButlessMemory-Felide.2)arraymoduleareareMogeMogeNareSaremogeNormogeNoreSoustAta.3)
 如果您尝试将错误的数据类型的值存储在Python数组中,该怎么办?Apr 27, 2025 am 12:10 AM
WhenyouattempttostoreavalueofthewrongdatatypeinaPythonarray,you'llencounteraTypeError.Thisisduetothearraymodule'sstricttypeenforcement,whichrequiresallelementstobeofthesametypeasspecifiedbythetypecode.Forperformancereasons,arraysaremoreefficientthanl
 Python标准库的哪一部分是:列表或数组?Apr 27, 2025 am 12:03 AM
pythonlistsarepartofthestAndArdLibrary,herilearRaysarenot.listsarebuilt-In,多功能,和Rused ForStoringCollections,而EasaraySaraySaraySaraysaraySaraySaraysaraySaraysarrayModuleandleandleandlesscommonlyusedDduetolimitedFunctionalityFunctionalityFunctionality。
 您应该检查脚本是否使用错误的Python版本执行?Apr 27, 2025 am 12:01 AM
ThescriptisrunningwiththewrongPythonversionduetoincorrectdefaultinterpretersettings.Tofixthis:1)CheckthedefaultPythonversionusingpython--versionorpython3--version.2)Usevirtualenvironmentsbycreatingonewithpython3.9-mvenvmyenv,activatingit,andverifying
 在Python阵列上可以执行哪些常见操作?Apr 26, 2025 am 12:22 AM
Pythonarrayssupportvariousoperations:1)Slicingextractssubsets,2)Appending/Extendingaddselements,3)Insertingplaceselementsatspecificpositions,4)Removingdeleteselements,5)Sorting/Reversingchangesorder,and6)Listcomprehensionscreatenewlistsbasedonexistin
 在哪些类型的应用程序中,Numpy数组常用?Apr 26, 2025 am 12:13 AM
NumPyarraysareessentialforapplicationsrequiringefficientnumericalcomputationsanddatamanipulation.Theyarecrucialindatascience,machinelearning,physics,engineering,andfinanceduetotheirabilitytohandlelarge-scaledataefficiently.Forexample,infinancialanaly
 您什么时候选择在Python中的列表上使用数组?Apr 26, 2025 am 12:12 AM
useanArray.ArarayoveralistinpythonwhendeAlingwithHomeSdata,performance-Caliticalcode,orinterFacingWithCcccode.1)同质性data:arrayssavememorywithtypedelements.2)绩效code-performance-clitionalcode-clitadialcode-critical-clitical-clitical-clitical-clitaine code:araysofferferbetterperperperformenterperformanceformanceformancefornalumericalicalialical.3)
 所有列表操作是否由数组支持,反之亦然?为什么或为什么不呢?Apr 26, 2025 am 12:05 AM
不,notalllistoperationsareSupportedByArrays,andviceversa.1)arraysdonotsupportdynamicoperationslikeappendorinsertwithoutresizing,wheremactssperformance.2)listssdonotguaranteeconeeconeconstanttanttanttanttanttanttanttanttimecomplecomecomecomplecomecomecomecomecomecomplecomectaccesslikearrikearraysodo。


热AI工具

Undresser.AI Undress
人工智能驱动的应用程序,用于创建逼真的裸体照片

AI Clothes Remover
用于从照片中去除衣服的在线人工智能工具。

Undress AI Tool
免费脱衣服图片

Clothoff.io
AI脱衣机

Video Face Swap
使用我们完全免费的人工智能换脸工具轻松在任何视频中换脸!

热门文章

热工具

禅工作室 13.0.1
功能强大的PHP集成开发环境

Atom编辑器mac版下载
最流行的的开源编辑器

Dreamweaver CS6
视觉化网页开发工具

WebStorm Mac版
好用的JavaScript开发工具

DVWA
Damn Vulnerable Web App (DVWA) 是一个PHP/MySQL的Web应用程序,非常容易受到攻击。它的主要目标是成为安全专业人员在合法环境中测试自己的技能和工具的辅助工具,帮助Web开发人员更好地理解保护Web应用程序的过程,并帮助教师/学生在课堂环境中教授/学习Web应用程序安全。DVWA的目标是通过简单直接的界面练习一些最常见的Web漏洞,难度各不相同。请注意,该软件中


