


这篇文章主要介绍了关于Python绘制3D图形,有着一定的参考价值,现在分享给大家,有需要的朋友可以参考一下
3D图形在数据分析、数据建模、图形和图像处理等领域中都有着广泛的应用,下面将给大家介绍一下如何使用python进行3D图形的绘制,包括3D散点、3D表面、3D轮廓、3D直线(曲线)以及3D文字等的绘制。
准备工作:
python中绘制3D图形,依旧使用常用的绘图模块matplotlib,但需要安装mpl_toolkits工具包,安装方法如下:windows命令行进入到python安装目录下的Scripts文件夹下,执行: pip install --upgrade matplotlib即可;linux环境下直接执行该命令。
安装好这个模块后,即可调用mpl_tookits下的mplot3d类进行3D图形的绘制。
下面以实例进行说明。
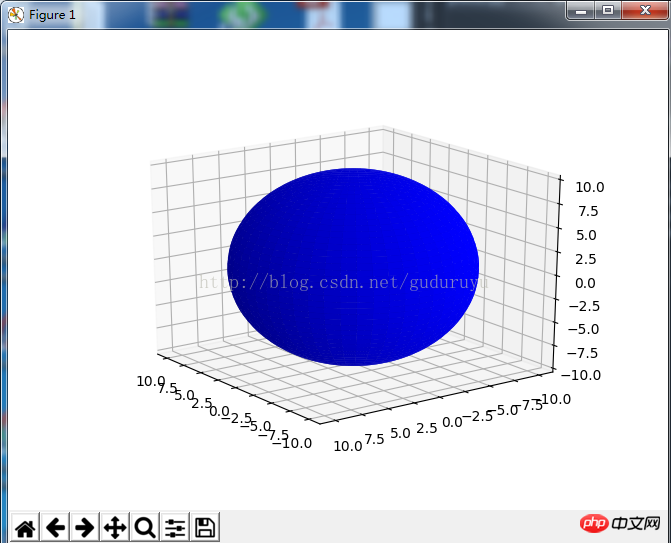
1、3D表面形状的绘制
from mpl_toolkits.mplot3d import Axes3D
import matplotlib.pyplot as plt
import numpy as np

fig = plt.figure()
ax = fig.add_subplot(111, projection='3d')

# Make data
u = np.linspace(0, 2 * np.pi, 100)
v = np.linspace(0, np.pi, 100)
x = 10 * np.outer(np.cos(u), np.sin(v))
y = 10 * np.outer(np.sin(u), np.sin(v))
z = 10 * np.outer(np.ones(np.size(u)), np.cos(v))

# Plot the surface
ax.plot_surface(x, y, z, color='b')

plt.show()
球表面,结果如下:
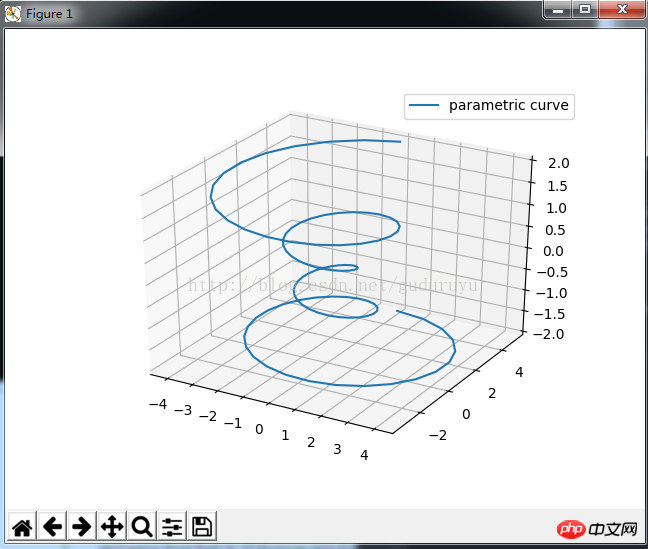
2、3D直线(曲线)的绘制
import matplotlib as mpl
from mpl_toolkits.mplot3d import Axes3D
import numpy as np
import matplotlib.pyplot as plt

mpl.rcParams['legend.fontsize'] = 10

fig = plt.figure()
ax = fig.gca(projection='3d')
theta = np.linspace(-4 * np.pi, 4 * np.pi, 100)
z = np.linspace(-2, 2, 100)
r = z**2 + 1
x = r * np.sin(theta)
y = r * np.cos(theta)
ax.plot(x, y, z, label='parametric curve')
ax.legend()

plt.show()
这段代码用于绘制一个螺旋状3D曲线,结果如下:
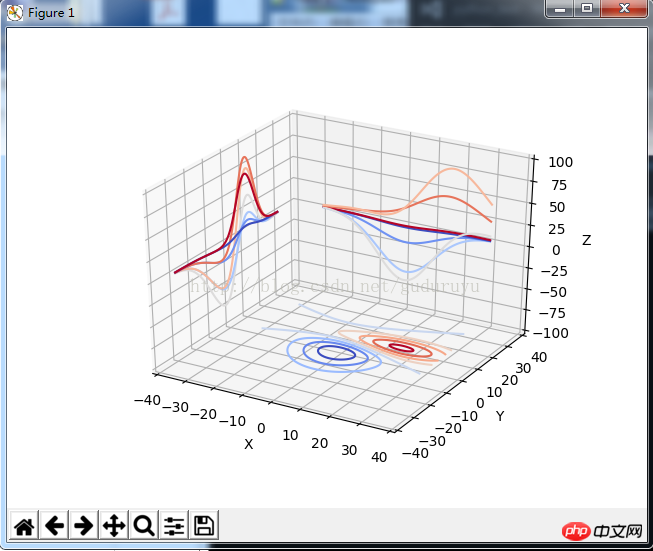
3、绘制3D轮廓
from mpl_toolkits.mplot3d import axes3d
import matplotlib.pyplot as plt
from matplotlib import cm

fig = plt.figure()
ax = fig.gca(projection='3d')
X, Y, Z = axes3d.get_test_data(0.05)
cset = ax.contour(X, Y, Z, zdir='z', offset=-100, cmap=cm.coolwarm)
cset = ax.contour(X, Y, Z, zdir='x', offset=-40, cmap=cm.coolwarm)
cset = ax.contour(X, Y, Z, zdir='y', offset=40, cmap=cm.coolwarm)

ax.set_xlabel('X')
ax.set_xlim(-40, 40)
ax.set_ylabel('Y')
ax.set_ylim(-40, 40)
ax.set_zlabel('Z')
ax.set_zlim(-100, 100)

plt.show()
绘制结果如下:
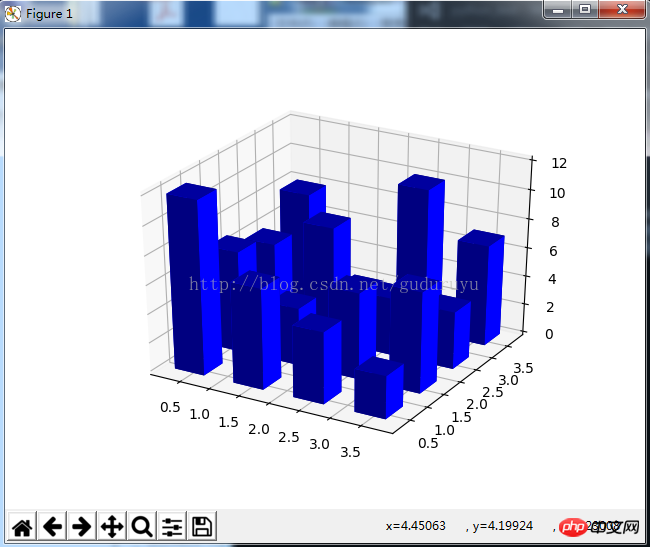
4、绘制3D直方图
from mpl_toolkits.mplot3d import Axes3D
import matplotlib.pyplot as plt
import numpy as np

fig = plt.figure()
ax = fig.add_subplot(111, projection='3d')
x, y = np.random.rand(2, 100) * 4
hist, xedges, yedges = np.histogram2d(x, y, bins=4, range=[[0, 4], [0, 4]])

# Construct arrays for the anchor positions of the 16 bars.
# Note: np.meshgrid gives arrays in (ny, nx) so we use 'F' to flatten xpos,
# ypos in column-major order. For numpy >= 1.7, we could instead call meshgrid
# with indexing='ij'.
xpos, ypos = np.meshgrid(xedges[:-1] + 0.25, yedges[:-1] + 0.25)
xpos = xpos.flatten('F')
ypos = ypos.flatten('F')
zpos = np.zeros_like(xpos)

# Construct arrays with the dimensions for the 16 bars.
dx = 0.5 * np.ones_like(zpos)
dy = dx.copy()
dz = hist.flatten()

ax.bar3d(xpos, ypos, zpos, dx, dy, dz, color='b', zsort='average')

plt.show()
绘制结果如下:
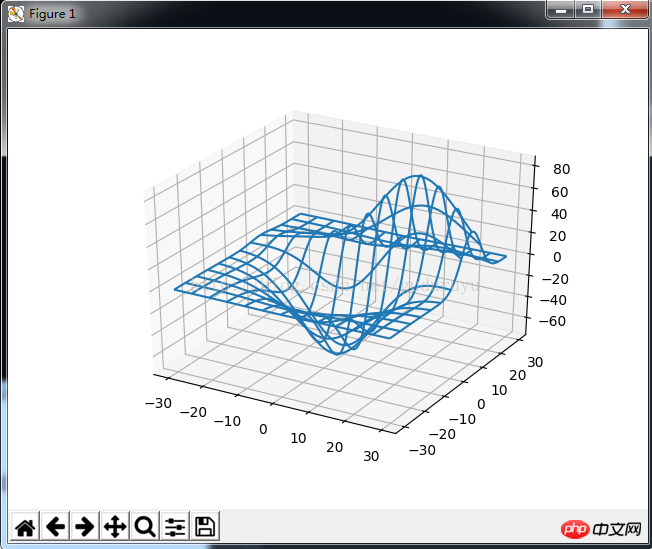
5、绘制3D网状线
from mpl_toolkits.mplot3d import axes3d
import matplotlib.pyplot as plt


fig = plt.figure()
ax = fig.add_subplot(111, projection='3d')

# Grab some test data.
X, Y, Z = axes3d.get_test_data(0.05)

# Plot a basic wireframe.
ax.plot_wireframe(X, Y, Z, rstride=10, cstride=10)

plt.show()
绘制结果如下:
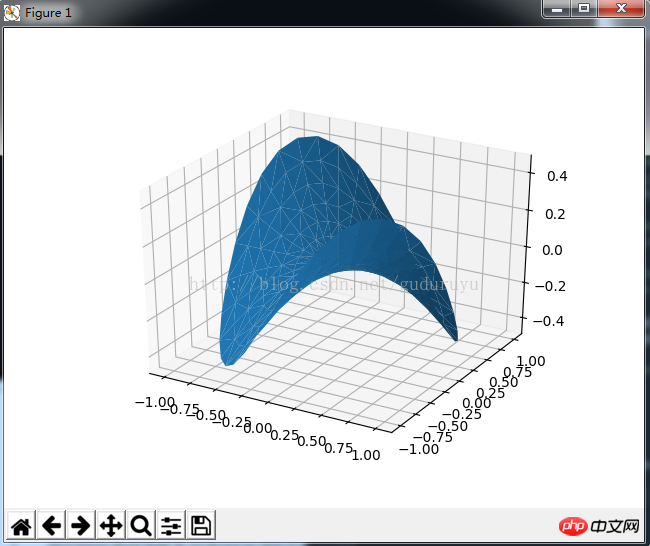
6、绘制3D三角面片图
from mpl_toolkits.mplot3d import Axes3D
import matplotlib.pyplot as plt
import numpy as np


n_radii = 8
n_angles = 36

# Make radii and angles spaces (radius r=0 omitted to eliminate duplication).
radii = np.linspace(0.125, 1.0, n_radii)
angles = np.linspace(0, 2*np.pi, n_angles, endpoint=False)

# Repeat all angles for each radius.
angles = np.repeat(angles[..., np.newaxis], n_radii, axis=1)

# Convert polar (radii, angles) coords to cartesian (x, y) coords.
# (0, 0) is manually added at this stage, so there will be no duplicate
# points in the (x, y) plane.
x = np.append(0, (radii*np.cos(angles)).flatten())
y = np.append(0, (radii*np.sin(angles)).flatten())

# Compute z to make the pringle surface.
z = np.sin(-x*y)

fig = plt.figure()
ax = fig.gca(projection='3d')

ax.plot_trisurf(x, y, z, linewidth=0.2, antialiased=True)

plt.show(
绘制结果如下:
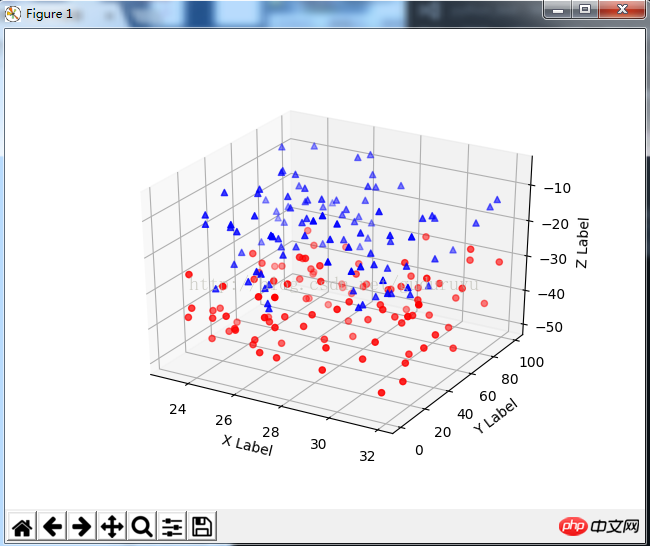
7、绘制3D散点图
from mpl_toolkits.mplot3d import Axes3D
import matplotlib.pyplot as plt
import numpy as np


def randrange(n, vmin, vmax):
 '''''
 Helper function to make an array of random numbers having shape (n, )
 with each number distributed Uniform(vmin, vmax).
 '''
 return (vmax - vmin)*np.random.rand(n) + vmin

fig = plt.figure()
ax = fig.add_subplot(111, projection='3d')

n = 100

# For each set of style and range settings, plot n random points in the box
# defined by x in [23, 32], y in [0, 100], z in [zlow, zhigh].
for c, m, zlow, zhigh in [('r', 'o', -50, -25), ('b', '^', -30, -5)]:
 xs = randrange(n, 23, 32)
 ys = randrange(n, 0, 100)
 zs = randrange(n, zlow, zhigh)
 ax.scatter(xs, ys, zs, c=c, marker=m)

ax.set_xlabel('X Label')
ax.set_ylabel('Y Label')
ax.set_zlabel('Z Label')

plt.show()
绘制结果如下:
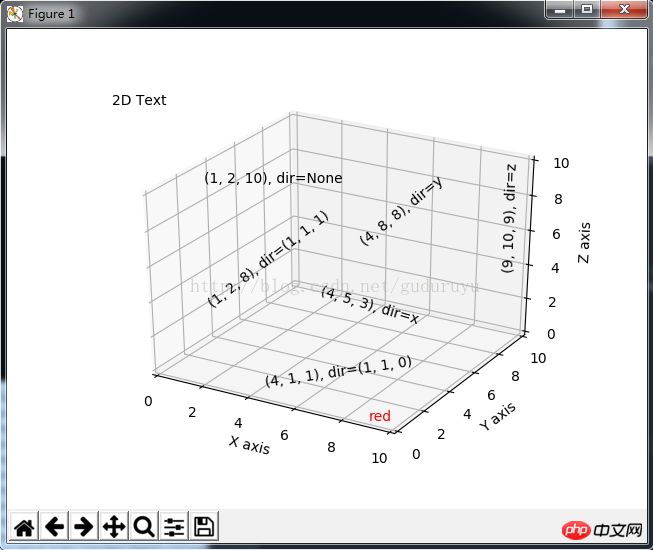
8、绘制3D文字
from mpl_toolkits.mplot3d import Axes3D
import matplotlib.pyplot as plt


fig = plt.figure()
ax = fig.gca(projection='3d')

# Demo 1: zdir
zdirs = (None, 'x', 'y', 'z', (1, 1, 0), (1, 1, 1))
xs = (1, 4, 4, 9, 4, 1)
ys = (2, 5, 8, 10, 1, 2)
zs = (10, 3, 8, 9, 1, 8)

for zdir, x, y, z in zip(zdirs, xs, ys, zs):
 label = '(%d, %d, %d), dir=%s' % (x, y, z, zdir)
 ax.text(x, y, z, label, zdir)

# Demo 2: color
ax.text(9, 0, 0, "red", color='red')

# Demo 3: text2D
# Placement 0, 0 would be the bottom left, 1, 1 would be the top right.
ax.text2D(0.05, 0.95, "2D Text", transform=ax.transAxes)

# Tweaking display region and labels
ax.set_xlim(0, 10)
ax.set_ylim(0, 10)
ax.set_zlim(0, 10)
ax.set_xlabel('X axis')
ax.set_ylabel('Y axis')
ax.set_zlabel('Z axis')

plt.show(
绘制结果如下:
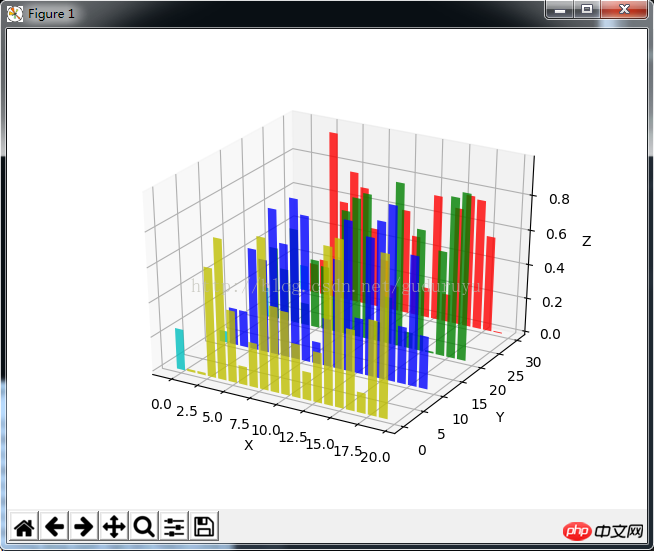
9、3D条状图
from mpl_toolkits.mplot3d import Axes3D
import matplotlib.pyplot as plt
import numpy as np

fig = plt.figure()
ax = fig.add_subplot(111, projection='3d')
for c, z in zip(['r', 'g', 'b', 'y'], [30, 20, 10, 0]):
 xs = np.arange(20)
 ys = np.random.rand(20)

 # You can provide either a single color or an array. To demonstrate this,
 # the first bar of each set will be colored cyan.
 cs = [c] * len(xs)
 cs[0] = 'c'
 ax.bar(xs, ys, zs=z, zdir='y', color=cs, alpha=0.8)

ax.set_xlabel('X')
ax.set_ylabel('Y')
ax.set_zlabel('Z')

plt.show()
绘制结果如下:
相关推荐:
以上是Python绘制3D图形的详细内容。更多信息请关注PHP中文网其他相关文章!

 Numpy数组与使用数组模块创建的数组有何不同?Apr 24, 2025 pm 03:53 PM
numpyArraysareAreBetterFornumericalialoperations andmulti-demensionaldata,而learthearrayModuleSutableforbasic,内存效率段
 Numpy数组的使用与使用Python中的数组模块阵列相比如何?Apr 24, 2025 pm 03:49 PM
numpyArraySareAreBetterForHeAvyNumericalComputing,而lelethearRayModulesiutable-usemoblemory-connerage-inderabledsswithSimpleDatateTypes.1)NumpyArsofferVerverVerverVerverVersAtility andPerformanceForlargedForlargedAtatasetSetsAtsAndAtasEndCompleXoper.2)
 CTYPES模块与Python中的数组有何关系?Apr 24, 2025 pm 03:45 PM
ctypesallowscreatingingangandmanipulatingc-stylarraysinpython.1)usectypestoInterfacewithClibrariesForperfermance.2)createc-stylec-stylec-stylarraysfornumericalcomputations.3)passarraystocfunctions foreforfunctionsforeffortions.however.however,However,HoweverofiousofmemoryManageManiverage,Pressiveo,Pressivero
 在Python的上下文中定义'数组”和'列表”。Apr 24, 2025 pm 03:41 PM
Inpython,一个“列表” isaversatile,mutableSequencethatCanholdMixedDatateTypes,而“阵列” isamorememory-效率,均质sepersequeSequeSequeReDencErequiringElements.1)
 Python列表是可变还是不变的?那Python阵列呢?Apr 24, 2025 pm 03:37 PM
pythonlistsandArraysareBothable.1)列表Sareflexibleandsupportereceneousdatabutarelessmory-Memory-Empefficity.2)ArraysareMoremoremoremoreMemoremorememorememorememoremorememogeneSdatabutlesserversEversementime,defteringcorcttypecrecttypececeDepeceDyusagetoagetoavoavoiDerrors。
 Python vs. C:了解关键差异Apr 21, 2025 am 12:18 AM
Python和C 各有优势,选择应基于项目需求。1)Python适合快速开发和数据处理,因其简洁语法和动态类型。2)C 适用于高性能和系统编程,因其静态类型和手动内存管理。
 Python vs.C:您的项目选择哪种语言?Apr 21, 2025 am 12:17 AM
选择Python还是C 取决于项目需求:1)如果需要快速开发、数据处理和原型设计,选择Python;2)如果需要高性能、低延迟和接近硬件的控制,选择C 。
 达到python目标:每天2小时的力量Apr 20, 2025 am 12:21 AM
通过每天投入2小时的Python学习,可以有效提升编程技能。1.学习新知识:阅读文档或观看教程。2.实践:编写代码和完成练习。3.复习:巩固所学内容。4.项目实践:应用所学于实际项目中。这样的结构化学习计划能帮助你系统掌握Python并实现职业目标。


热AI工具

Undresser.AI Undress
人工智能驱动的应用程序,用于创建逼真的裸体照片

AI Clothes Remover
用于从照片中去除衣服的在线人工智能工具。

Undress AI Tool
免费脱衣服图片

Clothoff.io
AI脱衣机

Video Face Swap
使用我们完全免费的人工智能换脸工具轻松在任何视频中换脸!

热门文章
热工具

SecLists
SecLists是最终安全测试人员的伙伴。它是一个包含各种类型列表的集合,这些列表在安全评估过程中经常使用,都在一个地方。SecLists通过方便地提供安全测试人员可能需要的所有列表,帮助提高安全测试的效率和生产力。列表类型包括用户名、密码、URL、模糊测试有效载荷、敏感数据模式、Web shell等等。测试人员只需将此存储库拉到新的测试机上,他就可以访问到所需的每种类型的列表。

PhpStorm Mac 版本
最新(2018.2.1 )专业的PHP集成开发工具

WebStorm Mac版
好用的JavaScript开发工具

记事本++7.3.1
好用且免费的代码编辑器

DVWA
Damn Vulnerable Web App (DVWA) 是一个PHP/MySQL的Web应用程序,非常容易受到攻击。它的主要目标是成为安全专业人员在合法环境中测试自己的技能和工具的辅助工具,帮助Web开发人员更好地理解保护Web应用程序的过程,并帮助教师/学生在课堂环境中教授/学习Web应用程序安全。DVWA的目标是通过简单直接的界面练习一些最常见的Web漏洞,难度各不相同。请注意,该软件中

