


这篇文章主要介绍了python如何实现可视化热力图,小编觉得挺不错的,现在分享给大家,也给大家做个参考。一起跟随小编过来看看吧
热力图
1、利用热力图可以看数据表里多个特征两两的相似度。参考官方API参数及地址:
seaborn.heatmap(data, vmin=None, vmax=None,cmap=None, center=None, robust=False, annot=None, fmt=’.2g’, annot_kws=None,linewidths=0, linecolor=’white’, cbar=True, cbar_kws=None, cbar_ax=None,square=False, xticklabels=’auto’, yticklabels=’auto’, mask=None, ax=None,**kwargs)
(1)热力图输入数据参数:
data:矩阵数据集,可以是numpy的数组(array),也可以是pandas的DataFrame。如果是DataFrame,则df的index/column信息会分别对应到heatmap的columns和rows,即pt.index是热力图的行标,pt.columns是热力图的列标
(2)热力图矩阵块颜色参数:
vmax,vmin:分别是热力图的颜色取值最大和最小范围,默认是根据data数据表里的取值确定
cmap:从数字到色彩空间的映射,取值是matplotlib包里的colormap名称或颜色对象,或者表示颜色的列表;改参数默认值:根据center参数设定
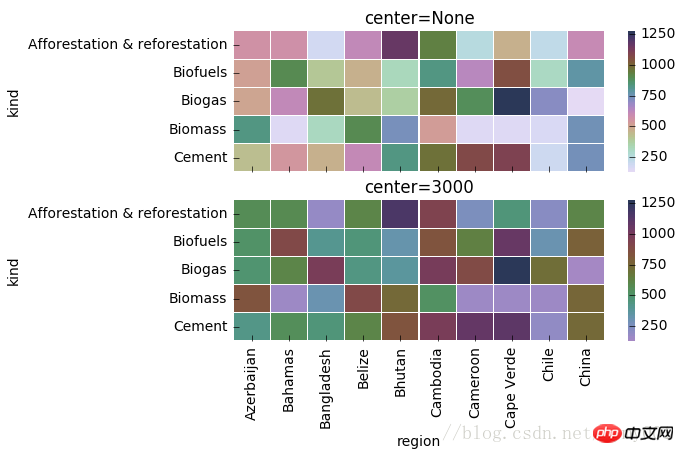
center:数据表取值有差异时,设置热力图的色彩中心对齐值;通过设置center值,可以调整生成的图像颜色的整体深浅;设置center数据时,如果有数据溢出,则手动设置的vmax、vmin会自动改变
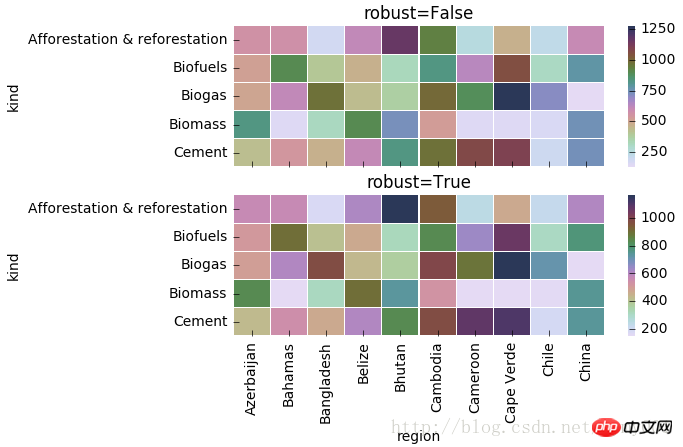
robust:默认取值False;如果是False,且没设定vmin和vmax的值,热力图的颜色映射范围根据具有鲁棒性的分位数设定,而不是用极值设定
(3)热力图矩阵块注释参数:
annot(annotate的缩写):默认取值False;如果是True,在热力图每个方格写入数据;如果是矩阵,在热力图每个方格写入该矩阵对应位置数据
fmt:字符串格式代码,矩阵上标识数字的数据格式,比如保留小数点后几位数字
annot_kws:默认取值False;如果是True,设置热力图矩阵上数字的大小颜色字体,matplotlib包text类下的字体设置;官方文档:
(4)热力图矩阵块之间间隔及间隔线参数:
linewidths:定义热力图里“表示两两特征关系的矩阵小块”之间的间隔大小
linecolor:切分热力图上每个矩阵小块的线的颜色,默认值是’white’
(5)热力图颜色刻度条参数:
cbar:是否在热力图侧边绘制颜色刻度条,默认值是True
cbar_kws:热力图侧边绘制颜色刻度条时,相关字体设置,默认值是None
cbar_ax:热力图侧边绘制颜色刻度条时,刻度条位置设置,默认值是None
(6)square:设置热力图矩阵小块形状,默认值是False
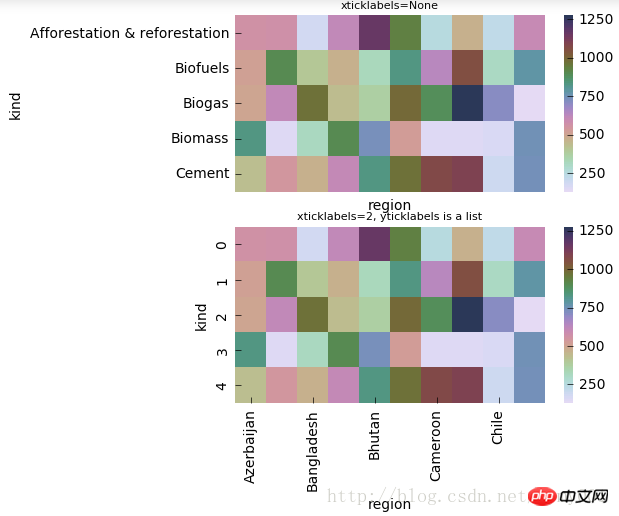
xticklabels, yticklabels:xticklabels控制每列标签名的输出;yticklabels控制每行标签名的输出。默认值是auto。如果是True,则以DataFrame的列名作为标签名。如果是False,则不添加行标签名。如果是列表,则标签名改为列表中给的内容。如果是整数K,则在图上每隔K个标签进行一次标注。 如果是auto,则自动选择标签的标注间距,将标签名不重叠的部分(或全部)输出
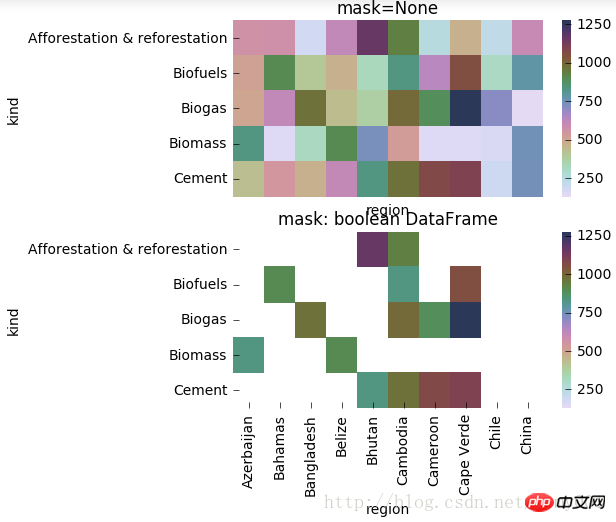
mask:控制某个矩阵块是否显示出来。默认值是None。如果是布尔型的DataFrame,则将DataFrame里True的位置用白色覆盖掉
ax:设置作图的坐标轴,一般画多个子图时需要修改不同的子图的该值
**kwargs:All other keyword arguments are passed to ax.pcolormesh
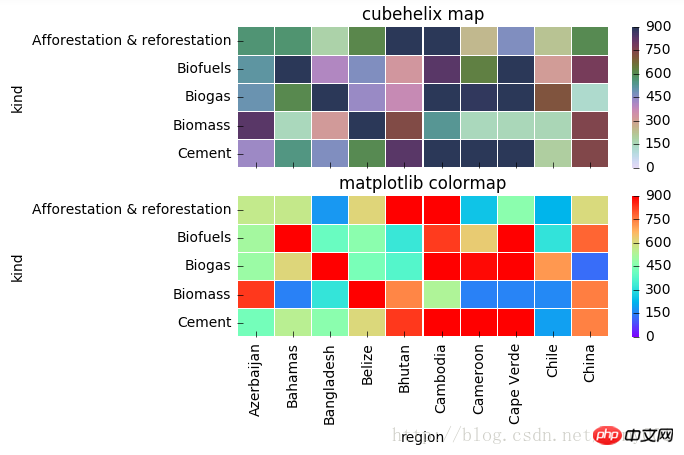
热力图矩阵块颜色参数
#cmap(颜色)

import matplotlib.pyplot as plt
% matplotlib inline

f, (ax1,ax2) = plt.subplots(figsize = (6,4),nrows=2)

# cmap用cubehelix map颜色
cmap = sns.cubehelix_palette(start = 1.5, rot = 3, gamma=0.8, as_cmap = True)
sns.heatmap(pt, linewidths = 0.05, ax = ax1, vmax=900, vmin=0, cmap=cmap)
ax1.set_title('cubehelix map')
ax1.set_xlabel('')
ax1.set_xticklabels([]) #设置x轴图例为空值
ax1.set_ylabel('kind')

# cmap用matplotlib colormap
sns.heatmap(pt, linewidths = 0.05, ax = ax2, vmax=900, vmin=0, cmap='rainbow')
# rainbow为 matplotlib 的colormap名称
ax2.set_title('matplotlib colormap')
ax2.set_xlabel('region')
ax2.set_ylabel('kind')
#center的用法(颜色)f, (ax1,ax2) = plt.subplots(figsize = (6, 4),nrows=2)

cmap = sns.cubehelix_palette(start = 1.5, rot = 3, gamma=0.8, as_cmap = True)
sns.heatmap(pt, linewidths = 0.05, ax = ax1, cmap=cmap, center=None )
ax1.set_title('center=None')
ax1.set_xlabel('')
ax1.set_xticklabels([]) #设置x轴图例为空值ax1.set_ylabel('kind')# 当center设置小于数据的均值时,生成的图片颜色要向0值代表的颜色一段偏移sns.heatmap(pt, linewidths = 0.05, ax = ax2, cmap=cmap, center=200)
ax2.set_title('center=3000')
ax2.set_xlabel('region')
ax2.set_ylabel('kind')
#robust的用法(颜色)f, (ax1,ax2) = plt.subplots(figsize = (6,4),nrows=2)

cmap = sns.cubehelix_palette(start = 1.5, rot = 3, gamma=0.8, as_cmap = True)

sns.heatmap(pt, linewidths = 0.05, ax = ax1, cmap=cmap, center=None, robust=False )
ax1.set_title('robust=False')
ax1.set_xlabel('')
ax1.set_xticklabels([]) #设置x轴图例为空值ax1.set_ylabel('kind')

sns.heatmap(pt, linewidths = 0.05, ax = ax2, cmap=cmap, center=None, robust=True )
ax2.set_title('robust=True')
ax2.set_xlabel('region')
ax2.set_ylabel('kind')
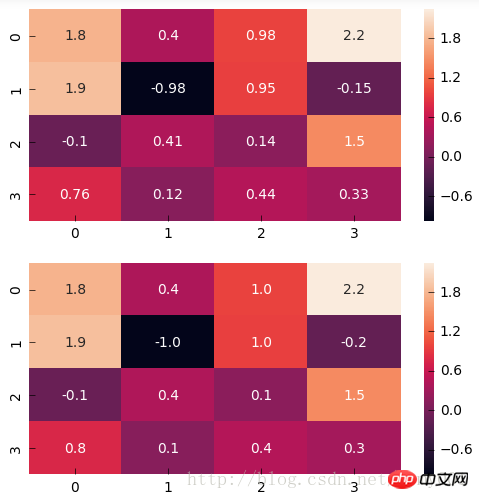
热力图矩阵块注释参数
#annot(矩阵上数字),annot_kws(矩阵上数字的大小颜色字体)matplotlib包text类下的字体设置import numpy as np
np.random.seed(20180316)
x = np.random.randn(4, 4)

f, (ax1, ax2) = plt.subplots(figsize=(6,6),nrows=2)

sns.heatmap(x, annot=True, ax=ax1)

sns.heatmap(x, annot=True, ax=ax2, annot_kws={'size':9,'weight':'bold', 'color':'blue'})# Keyword arguments for ax.text when annot is True.  http://stackoverflow.com/questions/35024475/seaborn-heatmap-key-words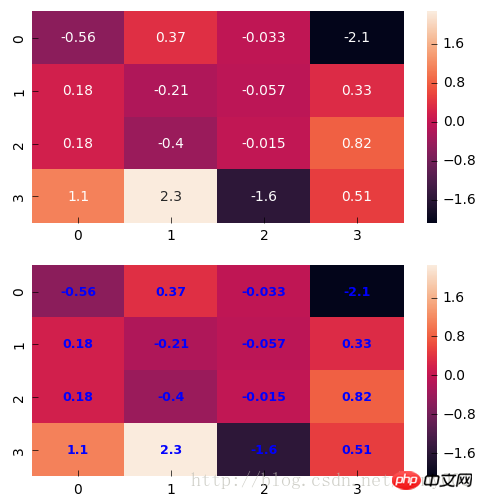
#fmt(字符串格式代码,矩阵上标识数字的数据格式,比如保留小数点后几位数字)import numpy as np
np.random.seed(0)
x = np.random.randn(4,4)

f, (ax1, ax2) = plt.subplots(figsize=(6,6),nrows=2)

sns.heatmap(x, annot=True, ax=ax1)

sns.heatmap(x, annot=True, fmt='.1f', ax=ax2)
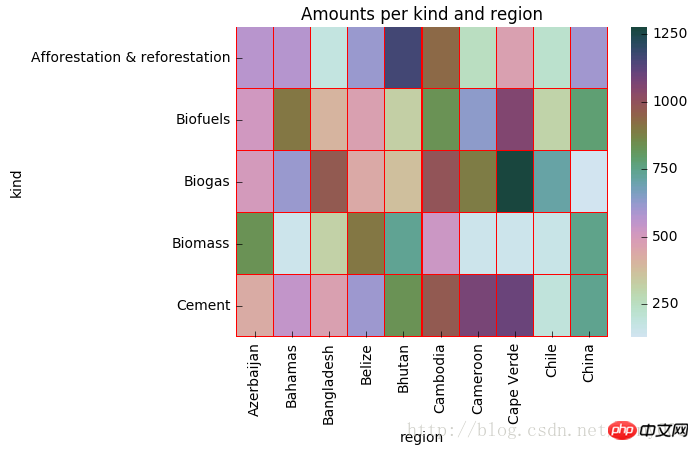
热力图矩阵块之间间隔及间隔线参数
#linewidths(矩阵小块的间隔),linecolor(切分热力图矩阵小块的线的颜色)import matplotlib.pyplot as plt
f, ax = plt.subplots(figsize = (6,4))
cmap = sns.cubehelix_palette(start = 1, rot = 3, gamma=0.8, as_cmap = True)
sns.heatmap(pt, cmap = cmap, linewidths = 0.05, linecolor= 'red', ax = ax)
ax.set_title('Amounts per kind and region')
ax.set_xlabel('region')
ax.set_ylabel('kind')
#xticklabels,yticklabels横轴和纵轴的标签名输出import matplotlib.pyplot as plt
f, (ax1,ax2) = plt.subplots(figsize = (5,5),nrows=2)

cmap = sns.cubehelix_palette(start = 1.5, rot = 3, gamma=0.8, as_cmap = True)

p1 = sns.heatmap(pt, ax=ax1, cmap=cmap, center=None, xticklabels=False)
ax1.set_title('xticklabels=None',fontsize=8)

p2 = sns.heatmap(pt, ax=ax2, cmap=cmap, center=None, xticklabels=2, yticklabels=list(range(5)))
ax2.set_title('xticklabels=2, yticklabels is a list',fontsize=8)
ax2.set_xlabel('region')
#mask对某些矩阵块的显示进行覆盖 f, (ax1,ax2) = plt.subplots(figsize = (5,5),nrows=2) cmap = sns.cubehelix_palette(start = 1.5, rot = 3, gamma=0.8, as_cmap = True) p1 = sns.heatmap(pt, ax=ax1, cmap=cmap, xticklabels=False, mask=None) ax1.set_title('mask=None') ax1.set_ylabel('kind') p2 = sns.heatmap(pt, ax=ax2, cmap=cmap, xticklabels=True, mask=(pt<800)) #mask对pt进行布尔型转化,结果为True的位置用白色覆盖 ax2.set_title('mask: boolean DataFrame') ax2.set_xlabel('region') ax2.set_ylabel('kind')
用mask实现:突出显示某些数据
f,(ax1,ax2) = plt.subplots(figsize=(4,6),nrows=2)
x = np.array([[1,2,3],[2,0,1],[-1,-2,0]])
sns.heatmap(x, annot=True, ax=ax1)
sns.heatmap(x, mask=x < 1, ax=ax2, annot=True, annot_kws={"weight": "bold"})   #把小于1的区域覆盖掉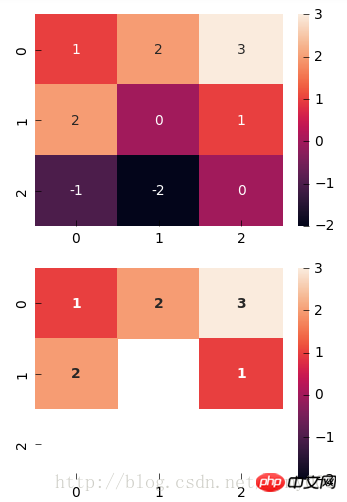
以上是python如何实现可视化热力图的详细内容。更多信息请关注PHP中文网其他相关文章!

 Python的科学计算中如何使用阵列?Apr 25, 2025 am 12:28 AM
Arraysinpython,尤其是Vianumpy,ArecrucialInsCientificComputingfortheireftheireffertheireffertheirefferthe.1)Heasuedfornumerericalicerationalation,dataAnalysis和Machinelearning.2)Numpy'Simpy'Simpy'simplementIncressionSressirestrionsfasteroperoperoperationspasterationspasterationspasterationspasterationspasterationsthanpythonlists.3)inthanypythonlists.3)andAreseNableAblequick
 您如何处理同一系统上的不同Python版本?Apr 25, 2025 am 12:24 AM
你可以通过使用pyenv、venv和Anaconda来管理不同的Python版本。1)使用pyenv管理多个Python版本:安装pyenv,设置全局和本地版本。2)使用venv创建虚拟环境以隔离项目依赖。3)使用Anaconda管理数据科学项目中的Python版本。4)保留系统Python用于系统级任务。通过这些工具和策略,你可以有效地管理不同版本的Python,确保项目顺利运行。
 与标准Python阵列相比,使用Numpy数组的一些优点是什么?Apr 25, 2025 am 12:21 AM
numpyarrayshaveseveraladagesoverandastardandpythonarrays:1)基于基于duetoc的iMplation,2)2)他们的aremoremoremorymorymoremorymoremorymoremorymoremoremory,尤其是WithlargedAtasets和3)效率化,效率化,矢量化函数函数函数函数构成和稳定性构成和稳定性的操作,制造
 阵列的同质性质如何影响性能?Apr 25, 2025 am 12:13 AM
数组的同质性对性能的影响是双重的:1)同质性允许编译器优化内存访问,提高性能;2)但限制了类型多样性,可能导致效率低下。总之,选择合适的数据结构至关重要。
 编写可执行python脚本的最佳实践是什么?Apr 25, 2025 am 12:11 AM
到CraftCraftExecutablePythcripts,lollow TheSebestPractices:1)Addashebangline(#!/usr/usr/bin/envpython3)tomakethescriptexecutable.2)setpermissionswithchmodwithchmod xyour_script.3)
 Numpy数组与使用数组模块创建的数组有何不同?Apr 24, 2025 pm 03:53 PM
numpyArraysareAreBetterFornumericalialoperations andmulti-demensionaldata,而learthearrayModuleSutableforbasic,内存效率段
 Numpy数组的使用与使用Python中的数组模块阵列相比如何?Apr 24, 2025 pm 03:49 PM
numpyArraySareAreBetterForHeAvyNumericalComputing,而lelethearRayModulesiutable-usemoblemory-connerage-inderabledsswithSimpleDatateTypes.1)NumpyArsofferVerverVerverVerverVersAtility andPerformanceForlargedForlargedAtatasetSetsAtsAndAtasEndCompleXoper.2)
 CTYPES模块与Python中的数组有何关系?Apr 24, 2025 pm 03:45 PM
ctypesallowscreatingingangandmanipulatingc-stylarraysinpython.1)usectypestoInterfacewithClibrariesForperfermance.2)createc-stylec-stylec-stylarraysfornumericalcomputations.3)passarraystocfunctions foreforfunctionsforeffortions.however.however,However,HoweverofiousofmemoryManageManiverage,Pressiveo,Pressivero


热AI工具

Undresser.AI Undress
人工智能驱动的应用程序,用于创建逼真的裸体照片

AI Clothes Remover
用于从照片中去除衣服的在线人工智能工具。

Undress AI Tool
免费脱衣服图片

Clothoff.io
AI脱衣机

Video Face Swap
使用我们完全免费的人工智能换脸工具轻松在任何视频中换脸!

热门文章
热工具

PhpStorm Mac 版本
最新(2018.2.1 )专业的PHP集成开发工具

Atom编辑器mac版下载
最流行的的开源编辑器

WebStorm Mac版
好用的JavaScript开发工具

SecLists
SecLists是最终安全测试人员的伙伴。它是一个包含各种类型列表的集合,这些列表在安全评估过程中经常使用,都在一个地方。SecLists通过方便地提供安全测试人员可能需要的所有列表,帮助提高安全测试的效率和生产力。列表类型包括用户名、密码、URL、模糊测试有效载荷、敏感数据模式、Web shell等等。测试人员只需将此存储库拉到新的测试机上,他就可以访问到所需的每种类型的列表。

EditPlus 中文破解版
体积小,语法高亮,不支持代码提示功能

