这次给大家带来在Vue中使用vue2-highcharts的图文详解,在Vue中使用vue2-highcharts的注意事项有哪些,下面就是实战案例,一起来看一下。
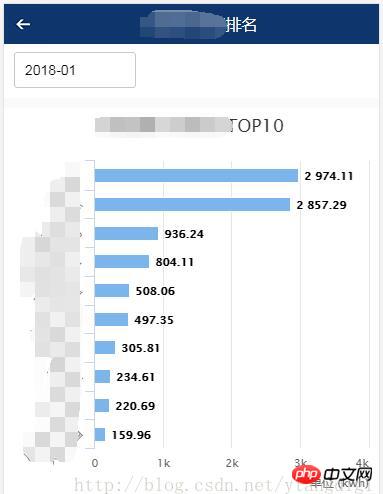
1、要实现的效果如下图:

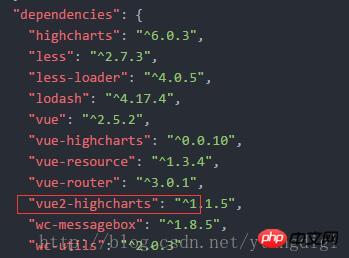
2、首先项目中引用vue2-highcharts
package.json中如下:

在命令行中输入:
cnpm install vue2-highcharts
3、页面代码如下:
<template>
<p >
<p>
<p id="transparent-header" class="rank-head container" >
<img src="../assets/index/back.png" class="rank-head-back" @click="routerBack"/>
<span >用能排名</span>
</p>
</p>
<p >
<p >
<datepicker v-on:picked="picked" style="margin-left:10px;"></datepicker>
</p>
<p >
</p>
</p>
<p >
<p class="charts">
<vue-highcharts :options="options" ref="maxLineCharts"></vue-highcharts>
</p>
</p>
<p >
<p class="charts">
<vue-highcharts :options="options" ref="minLineCharts"></vue-highcharts>
</p>
</p>
</p>
</template>
<script>
import datepicker from '../components/datepicker.vue'
import VueHighcharts from 'vue2-highcharts'
export default {
data() {
return{
topHeight:240,
freezeMon:'',
ownerFreeData: [],
options:{
credits: {
enabled: false
},
legend: {
enabled: false
},
global: {
useUTC: false
},
chart: {
type: 'bar'
},
title: {
text: ' '
},
subtitle: {
text: ''
},
xAxis:[{
categories: ['1', '2', '3', '4', '5','6', '7', '8', '9', '10'],
title: {
text: null
},
labels: {
rotation: -45
}
}],
yAxis:[{
min: 0,
labels:{
overflow: 'justify'
},
title: {
text: '单位 (kwh)',
align: 'high'
}
}],
tooltip: {
formatter: function(){
return this.x+':'+this.y+'kwh';
}
},
credits: {
enabled: false
},
plotOptions: {
bar: {
dataLabels: {
enabled: true
}
},
series: [{
type: 'bar'
}]
}
}
}
},
methods: {
picked(year, month, date) {
if(month < 10){
this.freezeMon = `${year}-0${month}`;
}else{
this.freezeMon = `${year}-${month}`;
}
this.getList();
},
routerBack(){
this.$router.go(-1);
},
getList(){
let maxLineCharts = this.$refs.maxLineCharts;
let minLineCharts = this.$refs.minLineCharts;
if(maxLineCharts != null && minLineCharts != null){
//移除所有Series
maxLineCharts.removeSeries();
minLineCharts.removeSeries();
//设置标题名
maxLineCharts.getChart().title.update({ text: '用能最大TOP10' });
minLineCharts.getChart().title.update({ text: '用能最小TOP10' });
var userType = sessionStorage.getItem('userType');
var areaCode = sessionStorage.getItem('areaCode');
this.$http.post(this.URLINFO + '/mobile/rankingMonitor/getDayFreezeApp.do',{yearMonth:this.freezeMon,userType:userType,areaCode:areaCode})
.then(function (res) {
var seriesData = []
var categoriesData = []
for(var i = 0;i < res.data.max.length; i++) {
//maxLineCharts.addSeries({name:res.data.max[i][1],data: [{name: res.data.max[i][1],y:res.data.max[i][2]}]});
seriesData.push([res.data.max[i][1],res.data.max[i][2]]);
categoriesData.push(res.data.max[i][1]);
}
maxLineCharts.addSeries({name: '用能',data: seriesData});
maxLineCharts.getChart().xAxis[0].setCategories(categoriesData);
seriesData = []
categoriesData = []
for(var i = 0;i < res.data.min.length; i++) {
//minLineCharts.addSeries({name:res.data.min[i][1],data: [{name: res.data.min[i][1],y:res.data.min[i][2]}]});
seriesData.push([res.data.min[i][1],res.data.min[i][2]]);
categoriesData.push(res.data.min[i][1]);
}
minLineCharts.addSeries({name: '用能',data: seriesData});
minLineCharts.getChart().xAxis[0].setCategories(categoriesData);
})
.catch(function (error) {
this.$toast('查询排名信息异常');
});
}
}
},
components: {
datepicker,
VueHighcharts
},
mounted () {
this.getList()
}
}
</script>
<style>
*{margin:0;padding:0; list-style:none }
h1,h2,h3,h4,h5,h6{font-size:16px; font-weight:normal;}
.rank-head{
width: 100%;
height: 40px;
position:fixed;
background: -webkit-linear-gradient(top,rgba(0,0,0,.6),rgba(0,0,0,0));
z-index: 999;
color: #fff;
font-size: 16px;
text-align: center;
line-height: 40px;
}
.container{
width: 100%;
overflow: hidden
}
.rank-head-back{
display: block;
float: left;
width: 40px;
height: 40px;
background: url("../assets/index/back.png") no-repeat center center;
background-size: 100% 100%;
}
</style>
相信看了本文案例你已经掌握了方法,更多精彩请关注php中文网其它相关文章!
推荐阅读:
AngularJS中@HostBinding()和@HostListener()有什么区别
以上是在Vue中使用vue2-highcharts的图文详解的详细内容。更多信息请关注PHP中文网其他相关文章!
 JavaScript框架:为现代网络开发提供动力May 02, 2025 am 12:04 AM
JavaScript框架的强大之处在于简化开发、提升用户体验和应用性能。选择框架时应考虑:1.项目规模和复杂度,2.团队经验,3.生态系统和社区支持。
 JavaScript,C和浏览器之间的关系May 01, 2025 am 12:06 AM
引言我知道你可能会觉得奇怪,JavaScript、C 和浏览器之间到底有什么关系?它们之间看似毫无关联,但实际上,它们在现代网络开发中扮演着非常重要的角色。今天我们就来深入探讨一下这三者之间的紧密联系。通过这篇文章,你将了解到JavaScript如何在浏览器中运行,C 在浏览器引擎中的作用,以及它们如何共同推动网页的渲染和交互。JavaScript与浏览器的关系我们都知道,JavaScript是前端开发的核心语言,它直接在浏览器中运行,让网页变得生动有趣。你是否曾经想过,为什么JavaScr
 node.js流带打字稿Apr 30, 2025 am 08:22 AM
Node.js擅长于高效I/O,这在很大程度上要归功于流。 流媒体汇总处理数据,避免内存过载 - 大型文件,网络任务和实时应用程序的理想。将流与打字稿的类型安全结合起来创建POWE
 Python vs. JavaScript:性能和效率注意事项Apr 30, 2025 am 12:08 AM
Python和JavaScript在性能和效率方面的差异主要体现在:1)Python作为解释型语言,运行速度较慢,但开发效率高,适合快速原型开发;2)JavaScript在浏览器中受限于单线程,但在Node.js中可利用多线程和异步I/O提升性能,两者在实际项目中各有优势。
 JavaScript的起源:探索其实施语言Apr 29, 2025 am 12:51 AM
JavaScript起源于1995年,由布兰登·艾克创造,实现语言为C语言。1.C语言为JavaScript提供了高性能和系统级编程能力。2.JavaScript的内存管理和性能优化依赖于C语言。3.C语言的跨平台特性帮助JavaScript在不同操作系统上高效运行。
 幕后:什么语言能力JavaScript?Apr 28, 2025 am 12:01 AM
JavaScript在浏览器和Node.js环境中运行,依赖JavaScript引擎解析和执行代码。1)解析阶段生成抽象语法树(AST);2)编译阶段将AST转换为字节码或机器码;3)执行阶段执行编译后的代码。
 Python和JavaScript的未来:趋势和预测Apr 27, 2025 am 12:21 AM
Python和JavaScript的未来趋势包括:1.Python将巩固在科学计算和AI领域的地位,2.JavaScript将推动Web技术发展,3.跨平台开发将成为热门,4.性能优化将是重点。两者都将继续在各自领域扩展应用场景,并在性能上有更多突破。
 Python vs. JavaScript:开发环境和工具Apr 26, 2025 am 12:09 AM
Python和JavaScript在开发环境上的选择都很重要。1)Python的开发环境包括PyCharm、JupyterNotebook和Anaconda,适合数据科学和快速原型开发。2)JavaScript的开发环境包括Node.js、VSCode和Webpack,适用于前端和后端开发。根据项目需求选择合适的工具可以提高开发效率和项目成功率。


热AI工具

Undresser.AI Undress
人工智能驱动的应用程序,用于创建逼真的裸体照片

AI Clothes Remover
用于从照片中去除衣服的在线人工智能工具。

Undress AI Tool
免费脱衣服图片

Clothoff.io
AI脱衣机

Video Face Swap
使用我们完全免费的人工智能换脸工具轻松在任何视频中换脸!

热门文章

热工具

记事本++7.3.1
好用且免费的代码编辑器

SublimeText3 Mac版
神级代码编辑软件(SublimeText3)

SecLists
SecLists是最终安全测试人员的伙伴。它是一个包含各种类型列表的集合,这些列表在安全评估过程中经常使用,都在一个地方。SecLists通过方便地提供安全测试人员可能需要的所有列表,帮助提高安全测试的效率和生产力。列表类型包括用户名、密码、URL、模糊测试有效载荷、敏感数据模式、Web shell等等。测试人员只需将此存储库拉到新的测试机上,他就可以访问到所需的每种类型的列表。

SublimeText3汉化版
中文版,非常好用

Dreamweaver Mac版
视觉化网页开发工具


