


测试环境
lyolzj@localhost /usr/local/src/zendopcache-7.0.5 $ lscpu
Architecture: i686
CPU op-mode(s): 32-bit, 64-bit
Byte Order: Little Endian
CPU(s): 4
On-line CPU(s) list: 0-3
Thread(s) per core: 2
Core(s) per socket: 2
Socket(s): 1
Vendor ID: GenuineIntel
CPU family: 6
Model: 37
Stepping: 2
CPU MHz: 1199.000
BogoMIPS: 4521.76
Virtualization: VT-x
L1d cache: 32K
L1i cache: 32K
L2 cache: 256K
L3 cache: 3072K
lyolzj@localhost /usr/local/src/zendopcache-7.0.5 $ free -m
total used free shared buffers cached
Mem: 1869 1654 215 265 4 526
-/+ buffers/cache: 1123 745
Swap: 3320 1 3319
??未安装opcache测试??
lyolzj@localhost ~ $ ab -n 1000 -c 10 http://localhost/wordpress/
This is ApacheBench, Version 2.3
Copyright 1996 Adam Twiss, Zeus Technology Ltd, http://www.zeustech.net/
Licensed to The Apache Software Foundation, http://www.apache.org/
Benchmarking localhost (be patient)
Completed 100 requests
Completed 200 requests
Completed 300 requests
Completed 400 requests
Completed 500 requests
Completed 600 requests
Completed 700 requests
Completed 800 requests
Completed 900 requests
Completed 1000 requests
Finished 1000 requests
Server Software: nginx/1.6.3
Server Hostname: localhost
Server Port: 80
Document Path: /wordpress/
Document Length: 8886 bytes
Concurrency Level: 10
Time taken for tests: 79.554 seconds
Complete requests: 1000
Failed requests: 0
Total transferred: 9099000 bytes
HTML transferred: 8886000 bytes
Requests per second: 12.57 [#/sec] (mean)
Time per request: 795.536 [ms] (mean)
Time per request: 79.554 [ms] (mean, across all concurrent requests)
Transfer rate: 111.70 [Kbytes/sec] received
Connection Times (ms)
min mean[+/-sd] median max
Connect: 0 0 0.0 0 0
Processing: 258 793 163.7 771 2227
Waiting: 249 777 163.1 755 2227
Total: 258 793 163.7 771 2227
Percentage of the requests served within a certain time (ms)
50% 771
66% 822
75% 849
80% 867
90% 926
95% 963
98% 1040
99% 1901
100% 2227 (longest request)
lyolzj@localhost ~ $ ab -n 1000 -c 100 http://localhost/wordpress/
This is ApacheBench, Version 2.3
Copyright 1996 Adam Twiss, Zeus Technology Ltd, http://www.zeustech.net/
Licensed to The Apache Software Foundation, http://www.apache.org/
Benchmarking localhost (be patient)
Completed 100 requests
Completed 200 requests
Completed 300 requests
Completed 400 requests
Completed 500 requests
Completed 600 requests
Completed 700 requests
Completed 800 requests
Completed 900 requests
Completed 1000 requests
Finished 1000 requests
Server Software: nginx/1.6.3
Server Hostname: localhost
Server Port: 80
Document Path: /wordpress/
Document Length: 8886 bytes
Concurrency Level: 100
Time taken for tests: 81.475 seconds
Complete requests: 1000
Failed requests: 0
Total transferred: 9099000 bytes
HTML transferred: 8886000 bytes
Requests per second: 12.27 [#/sec] (mean)
Time per request: 8147.464 [ms] (mean)
Time per request: 81.475 [ms] (mean, across all concurrent requests)
Transfer rate: 109.06 [Kbytes/sec] received
Connection Times (ms)
min mean[+/-sd] median max
Connect: 0 0 1.0 0 5
Processing: 232 7758 1533.2 7921 9906
Waiting: 220 7740 1532.2 7908 9893
Total: 237 7758 1532.3 7921 9906
Percentage of the requests served within a certain time (ms)
50% 7921
66% 8258
75% 8488
80% 8682
90% 9020
95% 9289
98% 9531
99% 9674
100% 9906 (longest request)
安装opcache
lyolzj@localhost /usr/local/src $ sudo wget http://pecl.php.net/get/zendopcache-7.0.5.tgz
lyolzj@localhost /usr/local/src $ sudo tar -zxf zendopcache-7.0.5.tgz
lyolzj@localhost /usr/local/src $ cd zendopcache-7.0.5/
lyolzj@localhost /usr/local/src/zendopcache-7.0.5 $ ls
config.m4 zend_accelerator_debug.c
config.w32 zend_accelerator_debug.h
CREDITS ZendAccelerator.h
LICENSE zend_accelerator_hash.c
Optimizer zend_accelerator_hash.h
README zend_accelerator_module.c
shared_alloc_mmap.c zend_accelerator_module.h
shared_alloc_posix.c zend_accelerator_util_funcs.c
shared_alloc_shm.c zend_accelerator_util_funcs.h
shared_alloc_win32.c zend_persist.c
tests zend_persist_calc.c
zend_accelerator_blacklist.c zend_persist.h
zend_accelerator_blacklist.h zend_shared_alloc.c
ZendAccelerator.c zend_shared_alloc.h
lyolzj@localhost /usr/local/src/zendopcache-7.0.5 $ sudo /usr/local/php5.4/bin/phpize
Configuring for:
PHP Api Version: 20100412
Zend Module Api No: 20100525
Zend Extension Api No: 220100525
lyolzj@localhost /usr/local/src/zendopcache-7.0.5 $ sudo ./configure --with-php-config=/usr/local/php5.4/bin/php-config
lyolzj@localhost /usr/local/src/zendopcache-7.0.5 $ sudo make
lyolzj@localhost /usr/local/src/zendopcache-7.0.5 $ sudo make install
Installing shared extensions: /usr/local/php5.4/lib/php/extensions/no-debug-non-zts-20100525/
配置opcache
在php.ini中添加
zend_extension= /usr/local/php5.4/lib/php/extensions/no-debug-non-zts-20100525/opcache.so
[opcache]
opcache.memory_consumption=128
opcache.interned_strings_buffer=8
opcache.max_accelerated_files=4000
opcache.revalidate_freq=60
opcache.fast_shutdown=1
opcache.enable_cli=1
lyolzj@localhost /usr/local/src/zendopcache-7.0.5 $ sudo netstat -ntlp
Active Internet connections (only servers)
Proto Recv-Q Send-Q Local Address Foreign Address State PID/Program name
tcp 0 0 127.0.0.1:9000 0.0.0.0:* LISTEN 2549/php-fpm.conf)
tcp 0 0 127.0.0.1:3306 0.0.0.0:* LISTEN
lyolzj@localhost /usr/local/src/zendopcache-7.0.5 $ sudo kill 2549
lyolzj@localhost /usr/local/src/zendopcache-7.0.5 $ sudo /usr/local/php5.4/sbin/php-fpm -y /usr/local/php5.4/etc/php-fpm.conf
lyolzj@localhost ~ $ ab -n 1000 -c 10 http://localhost/wordpress/
This is ApacheBench, Version 2.3
Copyright 1996 Adam Twiss, Zeus Technology Ltd, http://www.zeustech.net/
Licensed to The Apache Software Foundation, http://www.apache.org/
Benchmarking localhost (be patient)
Completed 100 requests
Completed 200 requests
Completed 300 requests
Completed 400 requests
Completed 500 requests
Completed 600 requests
Completed 700 requests
Completed 800 requests
Completed 900 requests
Completed 1000 requests
Finished 1000 requests
Server Software: nginx/1.6.3
Server Hostname: localhost
Server Port: 80
Document Path: /wordpress/
Document Length: 8886 bytes
Concurrency Level: 10
Time taken for tests: 27.116 seconds
Complete requests: 1000
Failed requests: 0
Total transferred: 9099000 bytes
HTML transferred: 8886000 bytes
Requests per second: 36.88 [#/sec] (mean)
Time per request: 271.158 [ms] (mean)
Time per request: 27.116 [ms] (mean, across all concurrent requests)
Transfer rate: 327.70 [Kbytes/sec] received
Connection Times (ms)
min mean[+/-sd] median max
Connect: 0 0 0.4 0 5
Processing: 190 270 55.9 260 628
Waiting: 185 263 54.2 254 625
Total: 190 270 56.1 260 632
Percentage of the requests served within a certain time (ms)
50% 260
66% 282
75% 301
80% 313
90% 341
95% 368
98% 398
99% 443
100% 632 (longest request)
lyolzj@localhost ~ $ ab -n 1000 -c 100 http://localhost/wordpress/
This is ApacheBench, Version 2.3
Copyright 1996 Adam Twiss, Zeus Technology Ltd, http://www.zeustech.net/
Licensed to The Apache Software Foundation, http://www.apache.org/
Benchmarking localhost (be patient)
Completed 100 requests
Completed 200 requests
Completed 300 requests
Completed 400 requests
Completed 500 requests
Completed 600 requests
Completed 700 requests
Completed 800 requests
Completed 900 requests
Completed 1000 requests
Finished 1000 requests
Server Software: nginx/1.6.3
Server Hostname: localhost
Server Port: 80
Document Path: /wordpress/
Document Length: 8886 bytes
Concurrency Level: 100
Time taken for tests: 28.363 seconds
Complete requests: 1000
Failed requests: 0
Total transferred: 9099000 bytes
HTML transferred: 8886000 bytes
Requests per second: 35.26 [#/sec] (mean)
Time per request: 2836.330 [ms] (mean)
Time per request: 28.363 [ms] (mean, across all concurrent requests)
Transfer rate: 313.28 [Kbytes/sec] received
Connection Times (ms)
min mean[+/-sd] median max
Connect: 0 1 1.7 0 7
Processing: 86 2700 515.9 2804 3322
Waiting: 81 2692 515.3 2797 3311
Total: 94 2700 514.3 2804 3322
Percentage of the requests served within a certain time (ms)
50% 2804
66% 2853
75% 2886
80% 2909
90% 3025
95% 3127
98% 3186
99% 3223
100% 3322 (longest request)
结果
由Time per request: 81.475 [ms] 变成Time per request: 28.363 [ms];提升了近3倍。

 在Laravel中使用Flash会话数据Mar 12, 2025 pm 05:08 PM
Laravel使用其直观的闪存方法简化了处理临时会话数据。这非常适合在您的应用程序中显示简短的消息,警报或通知。 默认情况下,数据仅针对后续请求: $请求 -
 php中的卷曲:如何在REST API中使用PHP卷曲扩展Mar 14, 2025 am 11:42 AM
PHP客户端URL(curl)扩展是开发人员的强大工具,可以与远程服务器和REST API无缝交互。通过利用Libcurl(备受尊敬的多协议文件传输库),PHP curl促进了有效的执行
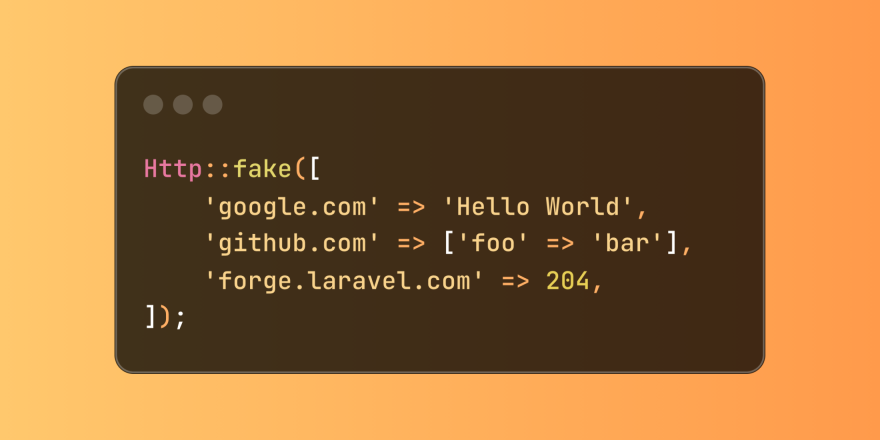 简化的HTTP响应在Laravel测试中模拟了Mar 12, 2025 pm 05:09 PM
Laravel 提供简洁的 HTTP 响应模拟语法,简化了 HTTP 交互测试。这种方法显着减少了代码冗余,同时使您的测试模拟更直观。 基本实现提供了多种响应类型快捷方式: use Illuminate\Support\Facades\Http; Http::fake([ 'google.com' => 'Hello World', 'github.com' => ['foo' => 'bar'], 'forge.laravel.com' =>
 PHP记录:PHP日志分析的最佳实践Mar 10, 2025 pm 02:32 PM
PHP日志记录对于监视和调试Web应用程序以及捕获关键事件,错误和运行时行为至关重要。它为系统性能提供了宝贵的见解,有助于识别问题并支持更快的故障排除
 在Codecanyon上的12个最佳PHP聊天脚本Mar 13, 2025 pm 12:08 PM
您是否想为客户最紧迫的问题提供实时的即时解决方案? 实时聊天使您可以与客户进行实时对话,并立即解决他们的问题。它允许您为您的自定义提供更快的服务
 解释PHP中晚期静态结合的概念。Mar 21, 2025 pm 01:33 PM
文章讨论了PHP 5.3中引入的PHP中的晚期静态结合(LSB),从而允许静态方法的运行时分辨率调用以获得更灵活的继承。 LSB的实用应用和潜在的触摸


热AI工具

Undresser.AI Undress
人工智能驱动的应用程序,用于创建逼真的裸体照片

AI Clothes Remover
用于从照片中去除衣服的在线人工智能工具。

Undress AI Tool
免费脱衣服图片

Clothoff.io
AI脱衣机

AI Hentai Generator
免费生成ai无尽的。

热门文章
热工具

SublimeText3 英文版
推荐:为Win版本,支持代码提示!

禅工作室 13.0.1
功能强大的PHP集成开发环境

Atom编辑器mac版下载
最流行的的开源编辑器

MinGW - 适用于 Windows 的极简 GNU
这个项目正在迁移到osdn.net/projects/mingw的过程中,你可以继续在那里关注我们。MinGW:GNU编译器集合(GCC)的本地Windows移植版本,可自由分发的导入库和用于构建本地Windows应用程序的头文件;包括对MSVC运行时的扩展,以支持C99功能。MinGW的所有软件都可以在64位Windows平台上运行。

Dreamweaver Mac版
视觉化网页开发工具

