


-
肯尼亚不同城市的天气数据分析和预报
- 简介
- 数据集概述
- 探索性数据分析
- 可视化主要天气特征
- 天气状况分析
- 城市降雨量
- 月平均气温
- 平均每月降雨量
- 天气变量之间的相关性
- 案例研究:城市特定趋势
- 结论
肯尼亚不同城市的天气数据分析和预报
介绍
在本文中,我将引导您使用 Python 分析天气模式。从识别温度趋势到可视化降雨量,这本分步指南非常适合任何有兴趣使用数据科学技术进行天气分析的人。我将探索代码、数据操作和可视化以获得实用见解。
在肯尼亚,天气在许多领域发挥着至关重要的作用,特别是农业、旅游业和户外活动。农民、企业和活动策划者需要准确的天气信息才能做出决策。然而,不同地区的天气模式可能存在很大差异,并且当前的预报系统可能并不总是提供本地化的见解。
该项目的目标是从 OpenWeatherMap API 和 Weather API 收集肯尼亚不同地区的实时天气数据。这些数据将存储在数据库中,并使用 Python 进行分析,以揭示以下内容:-
- 气温趋势
- 降雨模式 - 湿度和风况
在这个项目中,我分析了包含肯尼亚各个城市天气信息的数据集。该数据集包含 3,000 多行天气观测数据,包括温度、湿度、压力、风速、能见度和降雨量等因素。利用这些见解,我们的目标是提供准确的、针对特定地区的天气预报,以帮助农业、旅游业甚至管理等天气敏感行业的决策。
数据集概述
数据集由多个列构成:
- 日期时间 - 指示天气记录时间的时间戳。
- 城市和国家 - 天气观测位置。
- 纬度和经度 - 位置的地理坐标。
- 温度(摄氏度)- 记录的温度。
- 湿度 (%) - 空气中湿度的百分比。
- 压力 (hPa) - 以百帕斯卡为单位的大气压。
- 风速 (m/s) - 当时的风速。
- 雨量 (mm) - 以毫米为单位测量的降雨量。
- 云 (%) - 云覆盖的百分比。
- 天气状况和天气描述 - 天气的一般和详细描述(例如“云”、“散云”)。
这就是数据库中数据的结构方式。
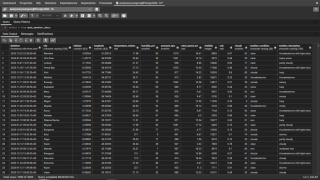
探索性数据分析
分析的第一步涉及对数据的基本探索。
_ 数据维度 - 数据集包含 3,000 行和 14 列。
_ Null Values - 最小的缺失数据,确保数据集对于进一步分析是可靠的。
print(df1[['temperature_celsius', 'humidity_pct', 'pressure_hpa', 'wind_speed_ms', 'rain', 'clouds']].describe())
使用上面的代码,我们计算了数字列的汇总统计数据,从而深入了解温度、湿度、压力、降雨量和云的范围、平均值和分布。
可视化主要天气特征
为了更清楚地了解天气特征,我们绘制了各种分布:
温度分布
sns.displot(df1['temperature_celsius'], bins=50, kde=True)
plt.title('Temperature Distribution')
plt.xlabel('Temperature (Celsius)')
该分布揭示了各城市温度的总体分布情况。 KDE 线图给出了温度概率分布的平滑估计。
降雨分布
sns.displot(df1['rain'], bins=50, kde=True)
plt.title('Rainfall Distribution')
plt.xlabel('Rainfall (mm/h)')
此代码分析肯尼亚城市的降雨量分布。
湿度、压力和风速
湿度 (%)、压力 (hPa) 和 风速 (m/s) 的类似分布图,每个图都提供了有关这些参数在数据集中的变化。
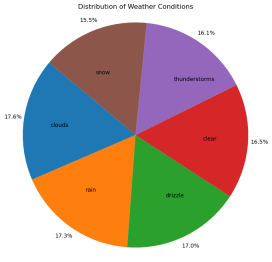
天气状况分析
使用饼图对天气状况(例如“云”、“雨”)进行计数和可视化,以显示其比例分布:
condition_counts = df1['weather_condition'].value_counts()

plt.figure(figsize=(8,8))
plt.pie(condition_counts, labels=condition_counts.index, autopct='%1.1f%%', pctdistance=1.1, labeldistance=0.6, startangle=140)
plt.title('Distribution of Weather Conditions')
plt.axis('equal')
plt.show()
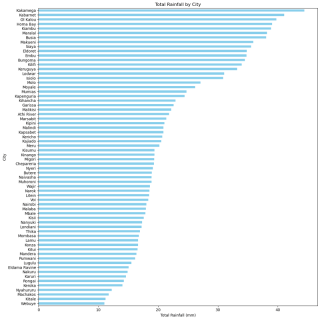
City-wise Rainfall
One of the key analysis was the total rainfall by city:
rainfall_by_city = df1.groupby('city')['rain'].sum().sort_values()

plt.figure(figsize=(12,12))
rainfall_by_city.plot(kind='barh', color='skyblue')
plt.title('Total Rainfall by City')
plt.xlabel('Total Rainfall (mm)')
plt.ylabel('City')
plt.tight_layout()
plt.show()
This bar plot highlighted which cities received the most rain over the observed period, with a few outliers showing significant rainfall compared to others.
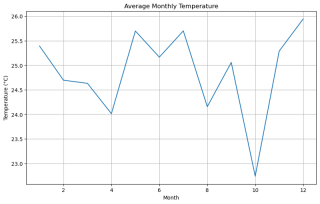
Average Monthly Temperature
avg_temp_by_month.plot(kind='line')
plt.title('Average Monthly Temperature')
The line chart revealed temperature fluctuations across different months, showing seasonal changes.
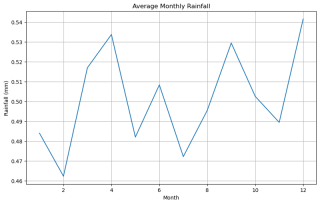
Average Monthly Rainfall
monthly_rain.plot(kind='line')
plt.title('Average Monthly Rainfall')
Similarly, rainfall was analyzed to observe how it varied month-to-month.
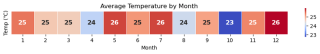
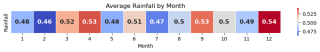
We also visualized the data using heatmaps for a more intuitive understanding of monthly temperature and rainfall.
Here are the heatmaps for the average monthly temperature and rainfall
Correlation Between Weather Variables
Next, I calculated the correlation matrix between key weather variables:
correlation_matrix = df1[['temperature_celsius', 'humidity_pct', 'pressure_hpa', 'wind_speed_ms', 'rain', 'clouds']].corr()
correlation_matrix
sns.heatmap(correlation_matrix, annot=True, cmap='coolwarm')
plt.title('Correlation Between Weather Variables')
This heatmap allowed us to identify relationships between variables. For example, we observed a negative correlation between temperature and humidity, as expected.
Case Study: City Specific Trends
I have focused on individual cities such as Mombasa and Nyeri, to explore their unique weather patterns:
Mombasa Temperature Trends
plt.plot(monthly_avg_temp_msa)
plt.title('Temperature Trends in Mombasa Over Time')
This city showed significant variation in temperature across the year.
Nyeri Rainfall Trends
plt.plot(monthly_avg_rain_nyr)
plt.title('Rainfall Trends in Nyeri Over Time')
The rainfall data for Nyeri displayed a clear seasonal pattern, with rainfall peaking during certain months.
Conclusion
This analysis provides a comprehensive overview of the weather conditions in major cities, highlighting the temperature, rainfall, and other key weather variables. By using visualizations like histograms, line charts, pie charts, and heatmaps, we were able to extract meaningful insights into the data. Further analysis could involve comparing these trends with historical weather patterns or exploring predictive modeling to forecast future weather trends.
You can find the Jupyter Notebook with the full code for this analysis in my GitHub repository).
以上是使用 Python 进行综合天气数据分析:温度、降雨趋势和可视化的详细内容。更多信息请关注PHP中文网其他相关文章!

 Python是否列表动态阵列或引擎盖下的链接列表?May 07, 2025 am 12:16 AM
pythonlistsareimplementedasdynamicarrays,notlinkedlists.1)他们areStoredIncoNtiguulMemoryBlocks,mayrequireRealLealLocationWhenAppendingItems,EmpactingPerformance.2)LinkesedlistSwoldOfferefeRefeRefeRefeRefficeInsertions/DeletionsButslowerIndexeDexedAccess,Lestpypytypypytypypytypy
 如何从python列表中删除元素?May 07, 2025 am 12:15 AM
pythonoffersFourmainMethodStoreMoveElement Fromalist:1)删除(值)emovesthefirstoccurrenceofavalue,2)pop(index)emovesanderturnsanelementataSpecifiedIndex,3)delstatementremoveselemsbybybyselementbybyindexorslicebybyindexorslice,and 4)
 试图运行脚本时,应该检查是否会遇到'权限拒绝”错误?May 07, 2025 am 12:12 AM
toresolvea“ dermissionded”错误Whenrunningascript,跟随台词:1)CheckAndAdjustTheScript'Spermissions ofchmod xmyscript.shtomakeitexecutable.2)nesureThEseRethEserethescriptistriptocriptibationalocatiforecationAdirectorywherewhereyOuhaveWritePerMissionsyOuhaveWritePermissionsyYouHaveWritePermissions,susteSyAsyOURHomeRecretectory。
 与Python的图像处理中如何使用阵列?May 07, 2025 am 12:04 AM
ArraysarecrucialinPythonimageprocessingastheyenableefficientmanipulationandanalysisofimagedata.1)ImagesareconvertedtoNumPyarrays,withgrayscaleimagesas2Darraysandcolorimagesas3Darrays.2)Arraysallowforvectorizedoperations,enablingfastadjustmentslikebri
 对于哪些类型的操作,阵列比列表要快得多?May 07, 2025 am 12:01 AM
ArraySaresificatificallyfasterthanlistsForoperationsBenefiting fromDirectMemoryAcccccccCesandFixed-Sizestructures.1)conscessingElements:arraysprovideconstant-timeaccessduetocontoconcotigunmorystorage.2)iteration:araysleveragececacelocality.3)
 说明列表和数组之间元素操作的性能差异。May 06, 2025 am 12:15 AM
ArraySareBetterForlement-WiseOperationsDuetofasterAccessCessCessCessCessCessAndOptimizedImplementations.1)ArrayshaveContiguucuulmemoryfordirectAccesscess.2)列出sareflexible butslible dueTopotentEnallymideNamicizing.3)forlarargedAtaTasetsetsetsetsetsetsetsetsetsetsetlib
 如何有效地对整个Numpy阵列进行数学操作?May 06, 2025 am 12:15 AM
在NumPy中进行整个数组的数学运算可以通过向量化操作高效实现。 1)使用简单运算符如加法(arr 2)可对数组进行运算。 2)NumPy使用C语言底层库,提升了运算速度。 3)可以进行乘法、除法、指数等复杂运算。 4)需注意广播操作,确保数组形状兼容。 5)使用NumPy函数如np.sum()能显着提高性能。
 您如何将元素插入python数组中?May 06, 2025 am 12:14 AM
在Python中,向列表插入元素有两种主要方法:1)使用insert(index,value)方法,可以在指定索引处插入元素,但在大列表开头插入效率低;2)使用append(value)方法,在列表末尾添加元素,效率高。对于大列表,建议使用append()或考虑使用deque或NumPy数组来优化性能。


热AI工具

Undresser.AI Undress
人工智能驱动的应用程序,用于创建逼真的裸体照片

AI Clothes Remover
用于从照片中去除衣服的在线人工智能工具。

Undress AI Tool
免费脱衣服图片

Clothoff.io
AI脱衣机

Video Face Swap
使用我们完全免费的人工智能换脸工具轻松在任何视频中换脸!

热门文章
热工具

mPDF
mPDF是一个PHP库,可以从UTF-8编码的HTML生成PDF文件。原作者Ian Back编写mPDF以从他的网站上“即时”输出PDF文件,并处理不同的语言。与原始脚本如HTML2FPDF相比,它的速度较慢,并且在使用Unicode字体时生成的文件较大,但支持CSS样式等,并进行了大量增强。支持几乎所有语言,包括RTL(阿拉伯语和希伯来语)和CJK(中日韩)。支持嵌套的块级元素(如P、DIV),

安全考试浏览器
Safe Exam Browser是一个安全的浏览器环境,用于安全地进行在线考试。该软件将任何计算机变成一个安全的工作站。它控制对任何实用工具的访问,并防止学生使用未经授权的资源。

SublimeText3汉化版
中文版,非常好用

VSCode Windows 64位 下载
微软推出的免费、功能强大的一款IDE编辑器

DVWA
Damn Vulnerable Web App (DVWA) 是一个PHP/MySQL的Web应用程序,非常容易受到攻击。它的主要目标是成为安全专业人员在合法环境中测试自己的技能和工具的辅助工具,帮助Web开发人员更好地理解保护Web应用程序的过程,并帮助教师/学生在课堂环境中教授/学习Web应用程序安全。DVWA的目标是通过简单直接的界面练习一些最常见的Web漏洞,难度各不相同。请注意,该软件中

