


Introduction
Snowflake has released an LLM assistant feature called Snowflake Copilot as a preview feature. With Snowflake Copilot, you can analyze table data using natural language.
On the other hand, Streamlit in Snowflake (SiS) allows you to easily incorporate generative AI and securely access table data. This made me think: could we create a more proactive natural language data analysis tool? So, I developed an app that can analyze and visualize data using natural language.
Note: This post represents my personal views and not those of Snowflake.
Feature Overview
Goals
- Usable by business users unfamiliar with SQL
- Ability to select DB / schema / table via mouse operations for analysis
- Capable of analyzing with very ambiguous natural language queries
Actual Screenshots (Excerpts)
The following are excerpts from analysis results using Cortex LLM (snowflake-arctic).

Note: We used this wine quality dataset.
Feature List
- Select Cortex LLM for analysis
- Choose DB / schema / table for analysis
- Display column information and sample data of the selected table
- Analysis using natural language input from users
- Automatic SQL generation for analysis
- Automatic execution of generated SQL
- Display of SQL query execution results
- Data insights provided by Cortex LLM
- Data visualization
- Appropriate graph selection and display by Cortex LLM
- Final data interpretation by Cortex LLM
Operating Conditions
- Snowflake account with access to Cortex LLM
- snowflake-ml-python 1.1.2 or later
Precautions
- Be cautious when using large datasets as no data limit is set
- Large result sets from generated SQL queries may take time to process
- Large result sets may cause LLM token limit errors
Source Code
from snowflake.snowpark.context import get_active_session
import streamlit as st
from snowflake.cortex import Complete as CompleteText
import snowflake.snowpark.functions as F
import pandas as pd
import numpy as np
import json
import plotly.express as px
# Get current session
session = get_active_session()
# Application title
st.title("Natural Language Data Analysis App")
# Cortex LLM settings
st.sidebar.title("Cortex LLM Settings")
lang_model = st.sidebar.radio("Select the language model you want to use",
("snowflake-arctic", "reka-flash", "reka-core",
"mistral-large2", "mistral-large", "mixtral-8x7b", "mistral-7b",
"llama3.1-405b", "llama3.1-70b", "llama3.1-8b",
"llama3-70b", "llama3-8b", "llama2-70b-chat",
"jamba-instruct", "gemma-7b")
)
# Function to escape column names
def escape_column_name(name):
return f'"{name}"'
# Function to get table information
def get_table_info(database, schema, table):
# Get column information
columns = session.sql(f"DESCRIBE TABLE {database}.{schema}.{table}").collect()
# Create DataFrame
column_df = pd.DataFrame(columns)
# Get row count
row_count = session.sql(f"SELECT COUNT(*) as count FROM {database}.{schema}.{table}").collect()[0]['COUNT']
# Get sample data
sample_data = session.sql(f"SELECT * FROM {database}.{schema}.{table} LIMIT 5").collect()
sample_df = pd.DataFrame(sample_data)
return column_df, row_count, sample_df
# Data analysis function
def analyze(df, query):
st.subheader("Result Analysis")
# Display basic statistical information
st.subheader("Basic Statistics")
st.write(df.describe())
# Use AI for data analysis
analysis_prompt = f"""
Based on the following dataframe and original question, please perform data analysis.
Concisely explain in English the insights, trends, and anomalies derived from the data.
If possible, please also mention the following points:
1. Data distribution and characteristics
2. Presence of abnormal values or outliers
3. Correlations between columns (if there are multiple numeric columns)
4. Time-series trends (if there is date or time data)
5. Category-specific features (if data can be divided by categories)
Dataframe:
{df.to_string()}
Original question:
{query}
"""
analysis = CompleteText(lang_model, analysis_prompt)
st.write(analysis)
# Data visualization function
def smart_data_visualization(df):
st.subheader("Smart Data Visualization")
if df.empty:
st.warning("The dataframe is empty. There is no data to visualize.")
return
# Request AI for graph suggestion
columns_info = "\n".join([f"{col} - type: {df[col].dtype}" for col in df.columns])
sample_data = df.head().to_string()
visualization_prompt = f"""
Analyze the information of the following dataframe and suggest the most appropriate graph type and the columns to use for its x-axis and y-axis.
Consider the characteristics of the data to ensure a meaningful visualization.
Column information:
{columns_info}
Sample data:
{sample_data}
Please provide only the following JSON data format as your response:
{{
"graph_type": "One of: scatter plot, bar chart, line chart, histogram, box plot",
"x_axis": "Column name to use for x-axis",
"y_axis": "Column name to use for y-axis (if applicable)",
"explanation": "Brief explanation of the selection reason"
}}
"""
ai_suggestion = CompleteText(lang_model, visualization_prompt)
try:
suggestion = json.loads(ai_suggestion)
graph_type = suggestion['graph_type']
x_axis = suggestion['x_axis']
y_axis = suggestion.get('y_axis') # y-axis might not be needed in some cases
explanation = suggestion['explanation']
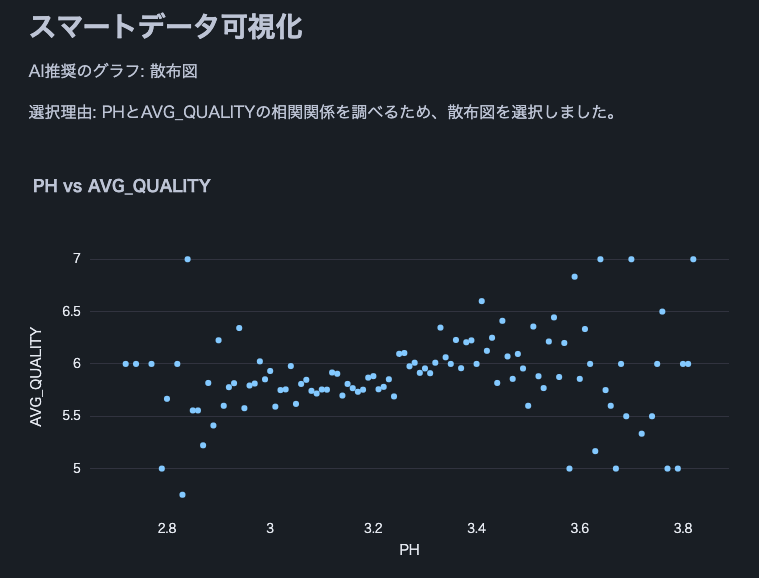
st.write(f"AI recommended graph: {graph_type}")
st.write(f"Selection reason: {explanation}")
if graph_type == "scatter plot":
fig = px.scatter(df, x=x_axis, y=y_axis, title=f"{x_axis} vs {y_axis}")
elif graph_type == "bar chart":
fig = px.bar(df, x=x_axis, y=y_axis, title=f"{y_axis} by {x_axis}")
elif graph_type == "line chart":
fig = px.line(df, x=x_axis, y=y_axis, title=f"{y_axis} over {x_axis}")
elif graph_type == "histogram":
fig = px.histogram(df, x=x_axis, title=f"Distribution of {x_axis}")
elif graph_type == "box plot":
fig = px.box(df, x=x_axis, y=y_axis, title=f"Distribution of {y_axis} by {x_axis}")
else:
st.warning(f"Unsupported graph type: {graph_type}")
return
st.plotly_chart(fig)
except json.JSONDecodeError:
st.error("Failed to parse AI suggestion. Please try again.")
except KeyError as e:
st.error(f"AI suggestion is missing necessary information: {str(e)}")
except Exception as e:
st.error(f"An error occurred while creating the graph: {str(e)}")
# AI interpretation of visualization
visualization_interpretation_prompt = f"""
Based on the following dataset and created graph, please provide a detailed interpretation of the data trends and characteristics in English.
Point out possible insights, patterns, anomalies, or areas that require additional analysis.
Dataset information:
Columns: {', '.join(df.columns)}
Number of rows: {len(df)}
Created graph:
Type: {graph_type}
X-axis: {x_axis}
Y-axis: {y_axis if y_axis else 'None'}
"""
ai_interpretation = CompleteText(lang_model, visualization_interpretation_prompt)
st.subheader("AI Interpretation of the Graph")
st.write(ai_interpretation)
# Function to handle cases where AI response is not just SQL query
def clean_sql_query(query):
# Remove leading and trailing whitespace
query = query.strip()
# If not starting with SQL keywords, remove everything up to the first SELECT
if not query.upper().startswith(('SELECT')):
keywords = ['SELECT']
for keyword in keywords:
if keyword in query.upper():
query = query[query.upper().index(keyword):]
break
return query
# Function for natural language querying of DB
def data_analysis_and_natural_language_query():
# Database selection
databases = session.sql("SHOW DATABASES").collect()
database_names = [row['name'] for row in databases]
selected_database = st.selectbox("Select a database", database_names)
if selected_database:
# Schema selection
schemas = session.sql(f"SHOW SCHEMAS IN DATABASE {selected_database}").collect()
schema_names = [row['name'] for row in schemas]
selected_schema = st.selectbox("Select a schema", schema_names)
if selected_schema:
# Table selection
tables = session.sql(f"SHOW TABLES IN {selected_database}.{selected_schema}").collect()
table_names = [row['name'] for row in tables]
selected_table = st.selectbox("Select a table", table_names)
if selected_table:
# Get table information
column_df, row_count, sample_df = get_table_info(selected_database, selected_schema, selected_table)
st.subheader("Table Information")
st.write(f"Table name: `{selected_database}.{selected_schema}.{selected_table}`")
st.write(f"Total rows: **{row_count:,}**")
st.subheader("Column Information")
st.dataframe(column_df)
st.subheader("Sample Data (showing only 5 rows)")
st.dataframe(sample_df)
# Stringify table information (for AI)
table_info = f"""
Table name: {selected_database}.{selected_schema}.{selected_table}
Total rows: {row_count}
Column information:
{column_df.to_string(index=False)}
Sample data:
{sample_df.to_string(index=False)}
"""
# Natural language input from user
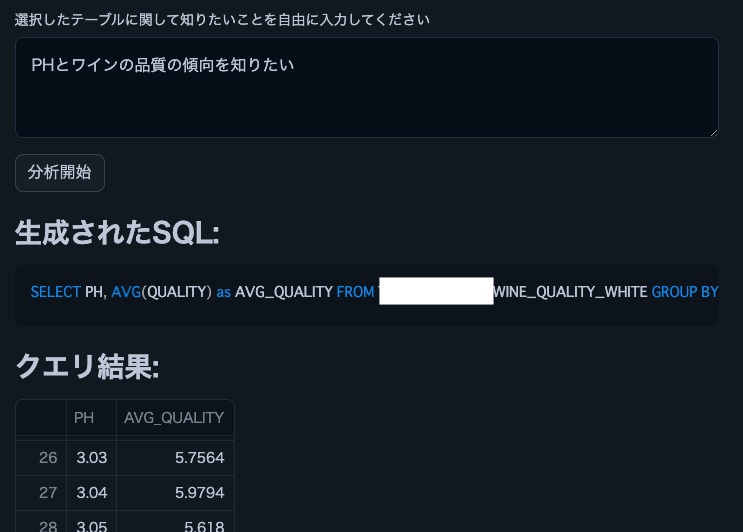
user_query = st.text_area("Enter what you want to know about the selected table")
if st.button("Start Analysis"):
if user_query:
# Use AI to generate SQL
prompt = f"""
Based on the following table information and question, please generate an appropriate SQL query.
Return only the generated SQL query without any additional response.
Table information:
{table_info}
Question: {user_query}
Notes:
- Follow Snowflake SQL syntax.
- Use aggregate functions to keep the query result size manageable.
- Use {selected_database}.{selected_schema}.{selected_table} as the table name.
"""
generated_sql = CompleteText(lang_model, prompt)
generated_sql = clean_sql_query(generated_sql)
st.subheader("Generated SQL:")
st.code(generated_sql, language='sql')
try:
# Execute the generated SQL
result = session.sql(generated_sql).collect()
df = pd.DataFrame(result)
st.subheader("Query Result:")
st.dataframe(df)
# Analyze results
analyze(df, user_query)
# Smart data visualization
smart_data_visualization(df)
except Exception as e:
st.error(f"An error occurred while executing the query: {str(e)}")
else:
st.warning("Please enter a question.")
# Execution part
data_analysis_and_natural_language_query()
Conclusion
The ability to easily analyze table data using natural language without SQL or Python knowledge could significantly broaden the scope of data utilization in enterprises for business users. By adding features like joining multiple tables or increasing the variety of visualization graphs, even more complex analyses can be performed. I encourage everyone to try implementing data analysis democratization using Streamlit in Snowflake.
Announcements
Snowflake What's New Updates on X
I'm sharing Snowflake's What's New updates on X. Please feel free to follow if you're interested!
English Version
Snowflake What's New Bot (English Version)
https://x.com/snow_new_en
Japanese Version
Snowflake What's New Bot (Japanese Version)
https://x.com/snow_new_jp
Change History
(20240914) Initial post
Original Japanese Article
https://zenn.dev/tsubasa_tech/articles/2608c820294860
以上是Try natural language data analysis with Streamlit in Snowflake (SiS)的详细内容。更多信息请关注PHP中文网其他相关文章!

 Python:自动化,脚本和任务管理Apr 16, 2025 am 12:14 AM
Python在自动化、脚本编写和任务管理中表现出色。1)自动化:通过标准库如os、shutil实现文件备份。2)脚本编写:使用psutil库监控系统资源。3)任务管理:利用schedule库调度任务。Python的易用性和丰富库支持使其在这些领域中成为首选工具。
 Python和时间:充分利用您的学习时间Apr 14, 2025 am 12:02 AM
要在有限的时间内最大化学习Python的效率,可以使用Python的datetime、time和schedule模块。1.datetime模块用于记录和规划学习时间。2.time模块帮助设置学习和休息时间。3.schedule模块自动化安排每周学习任务。
 Python:游戏,Guis等Apr 13, 2025 am 12:14 AM
Python在游戏和GUI开发中表现出色。1)游戏开发使用Pygame,提供绘图、音频等功能,适合创建2D游戏。2)GUI开发可选择Tkinter或PyQt,Tkinter简单易用,PyQt功能丰富,适合专业开发。
 Python vs.C:申请和用例Apr 12, 2025 am 12:01 AM
Python适合数据科学、Web开发和自动化任务,而C 适用于系统编程、游戏开发和嵌入式系统。 Python以简洁和强大的生态系统着称,C 则以高性能和底层控制能力闻名。
 2小时的Python计划:一种现实的方法Apr 11, 2025 am 12:04 AM
2小时内可以学会Python的基本编程概念和技能。1.学习变量和数据类型,2.掌握控制流(条件语句和循环),3.理解函数的定义和使用,4.通过简单示例和代码片段快速上手Python编程。
 Python:探索其主要应用程序Apr 10, 2025 am 09:41 AM
Python在web开发、数据科学、机器学习、自动化和脚本编写等领域有广泛应用。1)在web开发中,Django和Flask框架简化了开发过程。2)数据科学和机器学习领域,NumPy、Pandas、Scikit-learn和TensorFlow库提供了强大支持。3)自动化和脚本编写方面,Python适用于自动化测试和系统管理等任务。
 您可以在2小时内学到多少python?Apr 09, 2025 pm 04:33 PM
两小时内可以学到Python的基础知识。1.学习变量和数据类型,2.掌握控制结构如if语句和循环,3.了解函数的定义和使用。这些将帮助你开始编写简单的Python程序。
 如何在10小时内通过项目和问题驱动的方式教计算机小白编程基础?Apr 02, 2025 am 07:18 AM
如何在10小时内教计算机小白编程基础?如果你只有10个小时来教计算机小白一些编程知识,你会选择教些什么�...


热AI工具

Undresser.AI Undress
人工智能驱动的应用程序,用于创建逼真的裸体照片

AI Clothes Remover
用于从照片中去除衣服的在线人工智能工具。

Undress AI Tool
免费脱衣服图片

Clothoff.io
AI脱衣机

AI Hentai Generator
免费生成ai无尽的。

热门文章
热工具

DVWA
Damn Vulnerable Web App (DVWA) 是一个PHP/MySQL的Web应用程序,非常容易受到攻击。它的主要目标是成为安全专业人员在合法环境中测试自己的技能和工具的辅助工具,帮助Web开发人员更好地理解保护Web应用程序的过程,并帮助教师/学生在课堂环境中教授/学习Web应用程序安全。DVWA的目标是通过简单直接的界面练习一些最常见的Web漏洞,难度各不相同。请注意,该软件中

SublimeText3汉化版
中文版,非常好用

螳螂BT
Mantis是一个易于部署的基于Web的缺陷跟踪工具,用于帮助产品缺陷跟踪。它需要PHP、MySQL和一个Web服务器。请查看我们的演示和托管服务。

SublimeText3 英文版
推荐:为Win版本,支持代码提示!

mPDF
mPDF是一个PHP库,可以从UTF-8编码的HTML生成PDF文件。原作者Ian Back编写mPDF以从他的网站上“即时”输出PDF文件,并处理不同的语言。与原始脚本如HTML2FPDF相比,它的速度较慢,并且在使用Unicode字体时生成的文件较大,但支持CSS样式等,并进行了大量增强。支持几乎所有语言,包括RTL(阿拉伯语和希伯来语)和CJK(中日韩)。支持嵌套的块级元素(如P、DIV),

