


Introduction
Practice makes perfect.
Something that has a lot in common with being a data scientist. Theory is only one aspect of the equation; the most crucial aspect is putting theory into practice. I will make an effort to record today's entire process of developing my capstone project, which will involve studying a movie dataset.
These are the objectives:
Objective:
- Download a movie dataset from Kaggle or retrieve it using the TMDb API.
- Explore various aspects such as movie genres, ratings, director popularity, and release year trends.
- Create dashboards that visualize these trends and optionally recommend movies based on user preferences.
1. Data Collection
I decided to use Kaggle to find my dataset.It is crucial to keep in mind the crucial variables you will want for the dataset you are working with. Importantly, my dataset ought to include the following: trends in release year, popularity of directors, ratings, and movie genres. As a result, I must make sure the dataset I choose has the following, at the very least.
My dataset was located on Kaggle, and I'll provide the link below. You can obtain the CSV version of the file by downloading the dataset, unzipping it, and extracting it. You can look over it to comprehend what you already have and to truly realize what kinds of insights you hope to obtain from the data you will be examining.
2. Describing the data
First, we must import the required libraries and load the necessary data. I'm using the Python programming language and Jupyter Notebooks for my project so that I can write and see my code more efficiently.
You will import the libraries that we will be using and load the data as shown below.

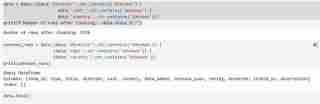
We will then run the following command to get more details about our dataset.
data.head() # dispalys the first rows of the dataset.
data.tail() # displays the last rows of the dataset.
data.shape # Shows the total number of rows and columns.
len(data.columns)  # Shows the total number of columns.
data.columns # Describes different column names.
data.dtypes # Describes different data types.
We now know what the dataset comprises and the insights we hope to extract after obtaining all the descriptions we require. Example: Using my dataset, I wish to investigate patterns in the popularity of directors, ratings distribution, and movie genres. I also want to suggest movies depending on user-selected preferences, such as preferred directors and genres.
3. Data Cleaning
This phase involves finding any null values and removing them. In order to move on with data visualization, we will also examine our dataset for duplicates and remove any that we find. To do this, we'll run the code that follows:
1. data['show_id'].value_counts().sum() # Checks for the total number of rows in my dataset
2. data.isna().sum() # Checks for null values(I found null values in director, cast and country columns)
3. data[['director', 'cast', 'country']] = data[['director', 'cast', 'country']].replace(np.nan, "Unknown ") # Fill null values with unknown.
We will then drop the rows with unknown values and confirm we have dropped all of them. We will also check the number of rows remaining that have cleaned data.
The code that follows looks for unique characteristics and duplicates. Although there are no duplicates in my dataset, you might still need to utilize it in case future datasets do.
data.duplicated().sum() # Checks for duplicates
data.nunique() # Checks for unique features
data.info # Confirms if nan values are present and also shows datatypes.
My date/time data type is an object and I would like for it to be in the proper date/time format so I used
data['date_added']=data['date_added'].astype('datetime64[ms]')to convert it to the proper format.
4. Data Visualization
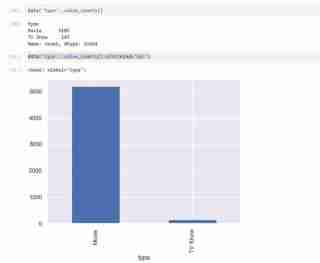
My dataset has two types of variables namely the TV shows and Movies in the types and I used a bar graph to present the categorical data with the values that they represent.

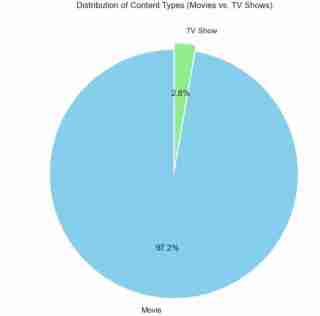
I also used a pie chart to represent the same as above. The code used is as follows and the outcome expected shown below.
## Pie chart display
plt.figure(figsize=(8, 8))
data['type'].value_counts().plot(
    kind='pie',
    autopct='%1.1f%%',
    colors=['skyblue', 'lightgreen'],
    startangle=90,
    explode=(0.05, 0)
)
plt.title('Distribution of Content Types (Movies vs. TV Shows)')
plt.ylabel('')
plt.show()
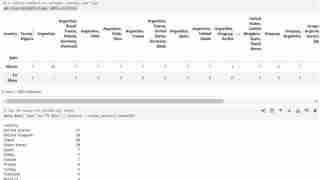
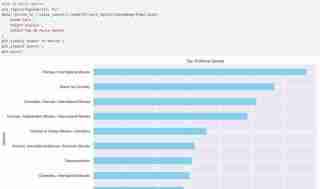
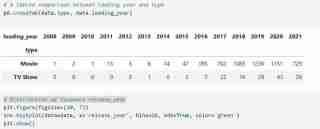
- I then did a tabled comparison using pd.crosstab(data.type, data.country) to create a tabled comparison of the types based on release dates, countries, and other factors (you can try changing the columns in the code independently). Below are the code to use and the expected comparison. I also checked the first 20 countries leading in the production of Tv Shows and and visualized them in a bar graph.You can copy the code in the image and ensure the outcome is almost similar to mine.

- I then checked for the top 10 movie genre as shown below. You can also use the code to check for TV shows. Just substitute with proper variable names.
- I extracted months and years separately from the dates provided so that I could visualize some histogram plots over the years.


- Checked for the top 10 directors with the most movies and compared them using a bar graph.

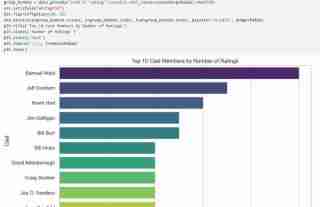
- Checked for the cast with the highest rating and visualized them.
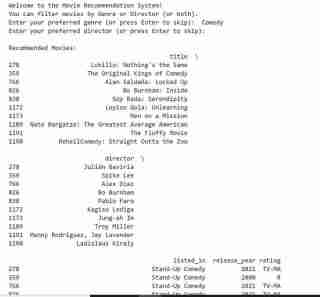
5. Recommendation System
I then built a recommendation system that takes in genre or director's name as input and produces a list of movies as per the user's preference. If the input cannot be matched by the algorithm then the user is notified.
The code for the above is as follows:
def recommend_movies(genre=None, director=None):
    recommendations = data
    if genre:
        recommendations = recommendations[recommendations['listed_in'].str.contains(genre, case=False, na=False)]
    if director:
        recommendations = recommendations[recommendations['director'].str.contains(director, case=False, na=False)]
    if not recommendations.empty:
        return recommendations[['title', 'director', 'listed_in', 'release_year', 'rating']].head(10)
    else:
        return "No movies found matching your preferences."
print("Welcome to the Movie Recommendation System!")
print("You can filter movies by Genre or Director (or both).")
user_genre = input("Enter your preferred genre (or press Enter to skip): ")
user_director = input("Enter your preferred director (or press Enter to skip): ")
recommendations = recommend_movies(genre=user_genre, director=user_director)
print("\nRecommended Movies:")
print(recommendations)
Conclusion
My goals were achieved, and I had a great time taking on this challenge since it helped me realize that, even though learning is a process, there are days when I succeed and fail. This was definitely a success. Here, we celebrate victories as well as defeats since, in the end, each teach us something. Do let me know if you attempt this.
Till next time!
Note!!
The code is in my GitHub:
https://github.com/MichelleNjeri-scientist/Movie-Dataset-Exploration-and-Visualization
The Kaggle dataset is:
https://www.kaggle.com/datasets/shivamb/netflix-shows
以上是电影数据集探索和可视化的详细内容。更多信息请关注PHP中文网其他相关文章!

 Python与C:学习曲线和易用性Apr 19, 2025 am 12:20 AM
Python更易学且易用,C 则更强大但复杂。1.Python语法简洁,适合初学者,动态类型和自动内存管理使其易用,但可能导致运行时错误。2.C 提供低级控制和高级特性,适合高性能应用,但学习门槛高,需手动管理内存和类型安全。
 Python vs. C:内存管理和控制Apr 19, 2025 am 12:17 AM
Python和C 在内存管理和控制方面的差异显着。 1.Python使用自动内存管理,基于引用计数和垃圾回收,简化了程序员的工作。 2.C 则要求手动管理内存,提供更多控制权但增加了复杂性和出错风险。选择哪种语言应基于项目需求和团队技术栈。
 科学计算的Python:详细的外观Apr 19, 2025 am 12:15 AM
Python在科学计算中的应用包括数据分析、机器学习、数值模拟和可视化。1.Numpy提供高效的多维数组和数学函数。2.SciPy扩展Numpy功能,提供优化和线性代数工具。3.Pandas用于数据处理和分析。4.Matplotlib用于生成各种图表和可视化结果。
 Python和C:找到合适的工具Apr 19, 2025 am 12:04 AM
选择Python还是C 取决于项目需求:1)Python适合快速开发、数据科学和脚本编写,因其简洁语法和丰富库;2)C 适用于需要高性能和底层控制的场景,如系统编程和游戏开发,因其编译型和手动内存管理。
 数据科学和机器学习的PythonApr 19, 2025 am 12:02 AM
Python在数据科学和机器学习中的应用广泛,主要依赖于其简洁性和强大的库生态系统。1)Pandas用于数据处理和分析,2)Numpy提供高效的数值计算,3)Scikit-learn用于机器学习模型构建和优化,这些库让Python成为数据科学和机器学习的理想工具。
 学习Python:2小时的每日学习是否足够?Apr 18, 2025 am 12:22 AM
每天学习Python两个小时是否足够?这取决于你的目标和学习方法。1)制定清晰的学习计划,2)选择合适的学习资源和方法,3)动手实践和复习巩固,可以在这段时间内逐步掌握Python的基本知识和高级功能。
 Web开发的Python:关键应用程序Apr 18, 2025 am 12:20 AM
Python在Web开发中的关键应用包括使用Django和Flask框架、API开发、数据分析与可视化、机器学习与AI、以及性能优化。1.Django和Flask框架:Django适合快速开发复杂应用,Flask适用于小型或高度自定义项目。2.API开发:使用Flask或DjangoRESTFramework构建RESTfulAPI。3.数据分析与可视化:利用Python处理数据并通过Web界面展示。4.机器学习与AI:Python用于构建智能Web应用。5.性能优化:通过异步编程、缓存和代码优
 Python vs.C:探索性能和效率Apr 18, 2025 am 12:20 AM
Python在开发效率上优于C ,但C 在执行性能上更高。1.Python的简洁语法和丰富库提高开发效率。2.C 的编译型特性和硬件控制提升执行性能。选择时需根据项目需求权衡开发速度与执行效率。


热AI工具

Undresser.AI Undress
人工智能驱动的应用程序,用于创建逼真的裸体照片

AI Clothes Remover
用于从照片中去除衣服的在线人工智能工具。

Undress AI Tool
免费脱衣服图片

Clothoff.io
AI脱衣机

AI Hentai Generator
免费生成ai无尽的。

热门文章
热工具

DVWA
Damn Vulnerable Web App (DVWA) 是一个PHP/MySQL的Web应用程序,非常容易受到攻击。它的主要目标是成为安全专业人员在合法环境中测试自己的技能和工具的辅助工具,帮助Web开发人员更好地理解保护Web应用程序的过程,并帮助教师/学生在课堂环境中教授/学习Web应用程序安全。DVWA的目标是通过简单直接的界面练习一些最常见的Web漏洞,难度各不相同。请注意,该软件中

SublimeText3汉化版
中文版,非常好用

SublimeText3 英文版
推荐:为Win版本,支持代码提示!

ZendStudio 13.5.1 Mac
功能强大的PHP集成开发环境

PhpStorm Mac 版本
最新(2018.2.1 )专业的PHP集成开发工具

