


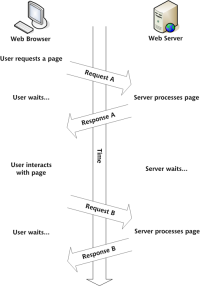
Google 地图有大量用于在地图上绘制点的功能,但是如果您想在图像上绘制点怎么办?这些 XY 图像绘图通常用于楼层地图、工作现场检查,甚至游戏。
在本指南中,我将向您展示如何使用 Leaflet.js 和 Google Apps 脚本创建带有可拖动点的交互式地图。我们将涵盖从设置地图到集成 Google 表格中的数据以及将其部署为网络应用程序的所有内容。
本指南将涵盖:
在 Google Apps 脚本 HTML 服务中设置 Leaflet.js
使用 Google 表格中的数据显示标记
移动标记时更新表格行
从地图创建新标记并保存到表格
从网络应用程序中删除标记
在 Google Apps 脚本 HTML 服务中设置 Leaflet.js
Leaflet.js 是最流行的开源地图库之一。它重量轻,易于使用,并且有很好的文档。它们支持大量不同的地图类型,包括“CRS.Simple”或坐标参考系统,它允许您提供背景图像。
Google 表格设置
首先创建一个名为map_pin 的工作表,其结构如下:
| id | title | x | y |
|---|---|---|---|
| 1 | test1 | 10 | 30 |
| 2 | test2 | 50 | 80 |
然后从“扩展”菜单中打开 Apps 脚本。
创建 HTML 文件
首先,我们将从 Leaflet 文档中的基本示例开始,以使库正常工作。您可以在此处的快速入门指南中查看完整示例。
添加一个新的HTML文件,命名为Index,并将内容设置为:
  <title>Quick Start - Leaflet</title>
  <meta charset="utf-8">
  <meta name="viewport" content="width=device-width, initial-scale=1.0">
  <link rel="stylesheet" href="https://unpkg.com/leaflet@1.9.3/dist/leaflet.css">
  <style>
    #map {
      height: 400px;
    }
  </style>


  <div id="map"></div>

  <script src="https://unpkg.com/leaflet@1.9.3/dist/leaflet.js"></script>
  <script>
    var map = L.map('map').setView([40.73, -73.99], 13);

    L.tileLayer('https://{s}.tile.openstreetmap.org/{z}/{x}/{y}.png', {
      maxZoom: 19,
      attribution: '© OpenStreetMap'
    }).addTo(map);

    var marker = L.marker([40.73, -73.99]).addTo(map)
      .bindPopup('Test Popup Message')
      .openPopup();
  </script>
然后使用以下内容更新 Code.gs 文件:
function doGet() {
  const html = HtmlService.createHtmlOutputFromFile('Index')
    .setTitle('Map with Draggable Points')
    .setXFrameOptionsMode(HtmlService.XFrameOptionsMode.ALLOWALL);
  return html;
}
保存,然后单击部署,并发布为 Web 应用程序。然后打开新部署的链接,您应该会看到 Leaflet.js 显示纽约的地图。

好的,这就是使用 Leaflet 的常规地图示例。现在介绍 CRS.Simple 地图类型,它允许提供背景图像。
使用传单教程中的示例更新 HTML。
  <title>CRS Simple Example - Leaflet</title>
  <meta charset="utf-8">
  <meta name="viewport" content="width=device-width, initial-scale=1.0">
  <link rel="stylesheet" href="https://unpkg.com/leaflet@1.9.3/dist/leaflet.css">
  <style>
    #map {
      height: 400px;
      width: 600px;
    }
    body {
      margin: 0;
      padding: 0;
    }
  </style>


  <div id="map"></div>

  <script src="https://unpkg.com/leaflet@1.9.3/dist/leaflet.js"></script>
  <script>
    // Set up the map with a simple CRS (no geographic projection)
    var map = L.map('map', {
      crs: L.CRS.Simple,
      minZoom: -1,
      maxZoom: 4
    });

    // Define the dimensions of the image
    var bounds = [[0, 0], [1000, 1000]];
    var image = L.imageOverlay('https://leafletjs.com/examples/crs-simple/uqm_map_full.png', bounds).addTo(map);

    // Set the initial view of the map to show the whole image
    map.fitBounds(bounds);

    // Optional: Add a marker or other elements to the map
    var marker = L.marker([500, 500]).addTo(map)
      .bindPopup('Center of the image')
      .openPopup();
  </script>
这里我们提供一张 1000 x 1000 像素的图像,然后将中心标记设置为 500、500。
点击保存,然后部署>测试部署,查看新的地图类型。您现在应该拥有一张带有背景图像并在中心绘制了标记的地图。

使用 Google 表格中的数据初始化地图
接下来,我们将使用工作表中的数据来填充地图上的一组标记。
首先,在 Code.gs 文件中添加一个函数来获取标记位置:
function getPinData(){
  const ss = SpreadsheetApp.getActiveSpreadsheet();
  const sh = ss.getSheetByName('map_pin');
  const data = sh.getDataRange().getValues();
  const json = arrayToJSON(data);
  //Logger.log(json);
  return json
}

function arrayToJSON(data=getPinData()){
  const headers = data[0];
  const rows = data.slice(1);
  let jsonData = [];
  for(row of rows){
    const obj = {};
    headers.forEach((h,i)=>obj[h] = row[i]);
    jsonData.push(obj)
  }
  //Logger.log(jsonData)
  return jsonData
}
在这里,我以 JSON 形式返回引脚,以便在下一节中更容易在 HTML 中使用它们。
现在向 HTML 添加一个函数以循环此 JSON 并在地图加载后创建地图图钉。
// Add map pins from sheet data
    google.script.run.withSuccessHandler(addMarkers).getPinData();

    function addMarkers(mapPinData) {
      mapPinData.forEach(pin => {
        const marker = L.marker([pin.x, pin.y], {
          draggable: true
        }).addTo(map);

        marker.bindPopup(`<b>${pin.title}`).openPopup();

        marker.on('dragend', function(e) {
          const latLng = e.target.getLatLng();
          console.log(`Marker ${pin.title} moved to: ${latLng.lat}, ${latLng.lng}`);
        });
      });
    }
</b>
保存,然后打开测试部署。您现在应该已经从工作表数据生成了标记!

每个图钉都有一个弹出窗口,其中包含该行的标题。此时图钉可以拖动,但我们仍然需要一个函数来保存新位置。
拖动时保存标记位置
为了保存新位置,我们需要两个函数:一个在 HTML 中用于捕获客户端的事件,另一个用于在服务器端的 Code.gs 文件中保存新位置。
使用以下内容更新 HTML:
    function addMarkers(mapPinData) {
      mapPinData.forEach(pin => {
        const { id, title, x, y } = pin;
        const marker = L.marker([x, y], {
          draggable: true
        }).addTo(map);

        marker.bindPopup(`<b>${title}</b>`).openPopup();

        marker.on('dragend', function(e) {
          const latLng = e.target.getLatLng();
          console.log(`Marker ${title} moved to: ${latLng.lat}, ${latLng.lng}`);
          saveMarkerPosition({ id, title, lat: latLng.lat, lng: latLng.lng });
        });
      });
    }

    function saveMarkerPosition({ id, title, lat, lng }) {
      google.script.run.saveMarkerPosition({ id, title, lat, lng });
    }
然后在Code.gs文件中添加一个函数来保存位置:
function saveMarkerPosition({ id, lat, lng }) {
  const ss = SpreadsheetApp.getActiveSpreadsheet();
  const sh = ss.getSheetByName('map_pin');
  const data = sh.getDataRange().getValues();

  for (let i = 1; i


<p>保存并刷新测试部署。现在,当拖动标记时,您应该会看到工作表更新!</p>

<p><img src="/static/imghwm/default1.png" data-src="https://img.php.cn/upload/article/000/000/000/172580614176490.jpg?x-oss-process=image/resize,p_40" class="lazy" alt="Building an Interactive XY Image Plot with Google Apps Script and Leaflet.js"></p>

<h2>


  添加新点
</h2>

<p>我们现在可以移动现有的点,但是添加新的点怎么样?同样,我们需要两个函数,一个在 HTML 中,一个在 Code.gs 文件中。</p>

<p>首先,在 HTML 中添加一个函数,以便在用户单击地图上的空白点时打开提示,并将值传递给服务器函数。<br>
</p>

<pre class="brush:php;toolbar:false">    // Function to add a new pin
    map.on('click', function(e) {
      const latLng = e.latlng;
      const title = prompt('Enter a title for the new pin:');
      if (title) {
        google.script.run.withSuccessHandler(function(id) {
          addNewMarker({ id, title, lat: latLng.lat, lng: latLng.lng });
        }).addNewPin({ title, lat: latLng.lat, lng: latLng.lng });
      }
    });

    function addNewMarker({ id, title, lat, lng }) {
      const marker = L.marker([lat, lng], {
        draggable: true
      }).addTo(map);

      marker.bindPopup(`<b>${title}</b>`).openPopup();

      marker.on('dragend', function(e) {
        const latLng = e.target.getLatLng();
        saveMarkerPosition({ id, title, lat: latLng.lat, lng: latLng.lng });
      });
    }
然后将函数添加到 Code.gs 以保存新行。
function addNewPin({ title, lat, lng }) {
  const ss = SpreadsheetApp.getActiveSpreadsheet();
  const sh = ss.getSheetByName('map_pin');

  // Check if there are any rows present, if not initialize ID
  const lastRow = sh.getLastRow();
  let newId = 1;

  if (lastRow > 0) {
    const lastId = sh.getRange(lastRow, 1).getValue();
    newId = lastId + 1;
  }

  sh.appendRow([newId, title, lat, lng]);

  return newId;
}
再次保存并刷新测试部署。现在,当您单击空白处时,您可以输入标题并保存新标记!

删除标记
最后,我们应该添加一种删除标记的方法,从而在地图视图中为我们提供完整的 CRUD 应用程序。
更新添加标记功能,为弹出窗口提供删除按钮:
      const popupContent = `<b>${title}</b><br><button onclick="deleteMarker(${id})">Delete Marker</button>`;
      marker.bindPopup(popupContent).openPopup();
然后添加客户端删除的功能:
// Function to delete a marker
  function deleteMarker(id) {
    const confirmed = confirm('Are you sure you want to delete this marker?');
    if (confirmed) {
      google.script.run.withSuccessHandler(() => {
        // Refresh the markers after deletion
        google.script.run.withSuccessHandler(addMarkers).getPinData();
      }).deleteMarker(id);
    }
  }
然后将匹配的函数添加到Code.gs文件中:
function deleteMarker(id) {
  const ss = SpreadsheetApp.getActiveSpreadsheet();
  const sh = ss.getSheetByName('map_pin');
  const data = sh.getDataRange().getValues();

  for (let i = 1; i


<h2>


  接下来是什么?
</h2>

<p>您还可以从这里做很多事情,例如向每个标记添加其他数据点、动态背景图像或其他单击和拖动交互。你甚至可以制作游戏!有用例的想法吗?在下面发表评论!</p>
以上是使用 Google Apps 脚本和 Leaflet.js 构建交互式 XY 图像图的详细内容。更多信息请关注PHP中文网其他相关文章!

 在JavaScript中替换字符串字符Mar 11, 2025 am 12:07 AM
JavaScript字符串替换方法详解及常见问题解答 本文将探讨两种在JavaScript中替换字符串字符的方法:在JavaScript代码内部替换和在网页HTML内部替换。 在JavaScript代码内部替换字符串 最直接的方法是使用replace()方法: str = str.replace("find","replace"); 该方法仅替换第一个匹配项。要替换所有匹配项,需使用正则表达式并添加全局标志g: str = str.replace(/fi
 构建您自己的Ajax Web应用程序Mar 09, 2025 am 12:11 AM
因此,在这里,您准备好了解所有称为Ajax的东西。但是,到底是什么? AJAX一词是指用于创建动态,交互式Web内容的一系列宽松的技术。 Ajax一词,最初由Jesse J创造

 如何在浏览器中优化JavaScript代码以进行性能?Mar 18, 2025 pm 03:14 PM
本文讨论了在浏览器中优化JavaScript性能的策略,重点是减少执行时间并最大程度地减少对页面负载速度的影响。
 如何使用浏览器开发人员工具有效调试JavaScript代码?Mar 18, 2025 pm 03:16 PM
本文讨论了使用浏览器开发人员工具的有效JavaScript调试,专注于设置断点,使用控制台和分析性能。
 jQuery矩阵效果Mar 10, 2025 am 12:52 AM
将矩阵电影特效带入你的网页!这是一个基于著名电影《黑客帝国》的酷炫jQuery插件。该插件模拟了电影中经典的绿色字符特效,只需选择一张图片,插件就会将其转换为充满数字字符的矩阵风格画面。快来试试吧,非常有趣! 工作原理 插件将图片加载到画布上,读取像素和颜色值: data = ctx.getImageData(x, y, settings.grainSize, settings.grainSize).data 插件巧妙地读取图片的矩形区域,并利用jQuery计算每个区域的平均颜色。然后,使用
 如何构建简单的jQuery滑块Mar 11, 2025 am 12:19 AM
本文将引导您使用jQuery库创建一个简单的图片轮播。我们将使用bxSlider库,它基于jQuery构建,并提供许多配置选项来设置轮播。 如今,图片轮播已成为网站必备功能——一图胜千言! 决定使用图片轮播后,下一个问题是如何创建它。首先,您需要收集高质量、高分辨率的图片。 接下来,您需要使用HTML和一些JavaScript代码来创建图片轮播。网络上有很多库可以帮助您以不同的方式创建轮播。我们将使用开源的bxSlider库。 bxSlider库支持响应式设计,因此使用此库构建的轮播可以适应任何
 如何使用Angular上传和下载CSV文件Mar 10, 2025 am 01:01 AM
数据集对于构建API模型和各种业务流程至关重要。这就是为什么导入和导出CSV是经常需要的功能。在本教程中,您将学习如何在Angular中下载和导入CSV文件


热AI工具

Undresser.AI Undress
人工智能驱动的应用程序,用于创建逼真的裸体照片

AI Clothes Remover
用于从照片中去除衣服的在线人工智能工具。

Undress AI Tool
免费脱衣服图片

Clothoff.io
AI脱衣机

AI Hentai Generator
免费生成ai无尽的。

热门文章
热工具

SublimeText3 Mac版
神级代码编辑软件(SublimeText3)

Dreamweaver Mac版
视觉化网页开发工具

PhpStorm Mac 版本
最新(2018.2.1 )专业的PHP集成开发工具

ZendStudio 13.5.1 Mac
功能强大的PHP集成开发环境

SublimeText3汉化版
中文版,非常好用

