


许多开发团队在服务器端利用 OpenTelemetry (OTeL) 从其应用程序收集日志、跟踪和指标等信号。然而,经常被忽视的是 OTeL 浏览器工具的强大功能。这种客户端可观察性数据可以提供有意义的见解,并通过连接客户端和服务器之间的跟踪来创建应用程序性能的全面视图。
什么是开放遥测?
OpenTelemetry 是一个工具、API 和 SDK 的集合,用于检测、生成、收集和导出遥测数据(指标、日志和跟踪)以进行分析,以便了解软件的性能和行为。
如果您有兴趣深入了解 OTeL,请查看我们最近的文章:什么是 OpenTelemetry 以及我为什么要关心?
浏览器应用程序中的 OpenTelemetry
当涉及到浏览器应用程序时,OpenTelemetry 可以提供以下方面的宝贵见解:
- 文档加载性能
- 用户互动
- 网络请求(XMLHttpRequest 和 Fetch)
这些见解使开发人员能够识别瓶颈、跟踪用户交互并监控网络请求,而无需手动检测。上面提到的是通过利用 OTeL 的自动检测相对容易获得的数据,但您也可以添加手动检测来收集客户端应用程序中任何其他代码的跟踪。
突出显示和 OpenTelemetry
Highlight 的 JavaScript SDK 提供了从客户端应用程序收集 OpenTelemetry 数据的内置支持。这种集成允许您将 OpenTelemetry 跟踪无缝合并到您的 Web 应用程序中。
通过突出显示启用 OpenTelemetry
OTeL 数据收集仍处于测试阶段,因此您需要在初始化 SDK 时通过设置 enableOtelTracing 配置选项来显式启用它:
H.init({
  // ...
  enableOtelTracing: true
})
通过这个简单的配置,Highlight 通过利用自动检测并进行一些额外的处理,自动收集您需要的大部分 OpenTelemetry 数据,以使数据在 Highlight 中更有用。
连接客户端和服务器跟踪
OpenTelemetry 最强大的功能之一是能够跨不同服务和环境连接跟踪。 Highlight 的 SDK 通过上下文传播促进了这一点,允许您创建从浏览器中的用户交互一直到后端服务的端到端跟踪。
其工作原理如下:
- 跟踪启动:当在浏览器中发起用户交互或网络请求时,SDK 会创建一个新的跨度或继续现有的跟踪。
-
标头注入:对于传出 HTTP 请求(XHR 和 Fetch),SDK 会自动将跟踪上下文标头注入到请求中。这些标头通常包括:
- traceparent:包含跟踪 ID、父跨度 ID 和跟踪标志。
- Tracestate:携带特定于供应商的跟踪信息。
- 服务器端接收:突出显示服务器端 SDK 提取这些标头并继续跟踪,将服务器端跨度链接到客户端跟踪。
- 跟踪完成:当请求完成并返回到客户端时,完整的跟踪(包括客户端和服务器跨度)可以在Highlight的UI中可视化。
客户端和服务器跟踪之间的这种连接提供了端到端的可见性,并且是页面速度洞察和客户端/服务器错误关联所需的链接。
对于服务器端渲染,其中代码在 HTML 发送到浏览器之前在服务器上执行,跟踪上下文通过 传播。添加到 HTML 的标签。
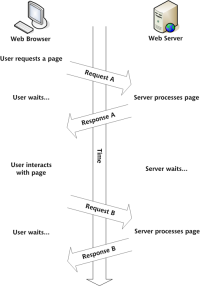
客户端-服务器跟踪生命周期示例
这是一个实际运作方式的简化示例:
- 用户单击您的 Web 应用程序中的按钮。
- Highlight SDK 会为此用户交互创建一个跨度。
- 此交互会触发对您后端的 API 调用。
- SDK 自动将跟踪标头注入此 API 调用中。
- 您的后端接收请求,提取跟踪上下文,并继续跟踪。
- 后端处理请求并发送响应。
- 客户端收到响应并完成跨度。
结果是显示请求的完整旅程的单个跟踪,从浏览器中的初始用户交互,通过后端服务,再返回到客户端。
好处
客户端和服务器跟踪之间的这种连接提供了几个好处:
- End-to-End Visibility: You can trace a user's action all the way through your system, making it easier to diagnose issues and understand performance bottlenecks.
- Performance Optimization: By seeing the complete picture, you can identify whether performance issues are occurring on the client-side, server-side, or in the network communication between them.
- Error Correlation: If an error occurs, you can see the full context of what led to that error, including any relevant client-side actions or server-side processing.
By leveraging Highlight's OpenTelemetry integration, you can gain these insights with minimal configuration, allowing you to focus on improving your application's performance and user experience.
Handling Server-Initiated Traces
When a request for a page is made by fetching a new URL in the browser we don't have the JS SDK initialized in the browser until the server returns the HTML and renders the page, then fetches all the JS assets to render the app. In this case you pass the trace ID from the server to the client in a tag to handoff the trace initiated on the server to the client.
Here is an example of what the meta tag looks like in the browser:
<meta name="traceparent" content="00-ab42124a3c573678d4d8b21ba52df3bf-d21f7bc17caa5aba-01">
Note that the Highlight server SDKs often have helpers to create this tag. Here's an example using the Highlight Ruby SDK
The browser OTeL instrumentation gathers timing information from window.performance.timing and creates spans for all the different timing events in the browser. This instrumentation parses the tag and associates all the spans it creates with trace data from the tag. This is illustrated in the screenshot of the flame graph below.

Here's how to parse what's going on in this flame graph:
- The documentLoad span shows the full timing from submitting the URL in the browser to be loaded to having all the assets loaded and the page being fully interactive. The timing data for this span is gathered from window.performance.timing since we can't actually initiate a span before the JS loads.
- The PagesController#home is the first span created on the server. You can trace the server code execution required to render the HTML that will be returned to the browser. When the HTML is returned to the browser the documentFetch span finishes.
- After the HTML is loaded int he browser you can see the requests for the page's resources (all the JS and CSS files), these are the resourceFetch spans.
These resource timings provide a full picture of your app's load time, making it clear where the opportunities are to improve performance and provide a better UX.
Leveraging OpenTelemetry Data in Highlight
Collecting OpenTelemetry data is one thing, but gleaning actionable insights is another. You need some way of visualizing the data (like the flame graph shown above) in order to get actionable insights. Highlight exposes this data a few ways.
Viewing Traces in Highlight
When you open Highlight's UI, you'll find a dedicated section for traces. Here, you can see a list of all the traces collected from your application, including those that span from the browser to your backend services.
Trace List: This view provides an overview of all traces, typically sorted by timestamp. You can filter and search for specific traces based on various criteria such as duration, error status, or custom attributes.
-
Trace Detail View: Clicking on a specific trace opens a detailed view, showing the full journey of a request or user interaction. This view includes:
- A flame graph visualization of the trace, showing the hierarchy and timing of spans.
- Detailed information about each span, including start time, duration, and any custom attributes or events.
- For spans representing network requests, you can see details like HTTP method, status code, and headers.
Cross-Service Tracing: For traces that span from the browser to your backend services, you'll see a seamless view of the entire request lifecycle. This makes it easy to identify whether performance issues are occurring on the client-side, server-side, or in the network communication between them.
Analyzing Resource Timings and Web Vitals
Highlight's metrics product provides powerful tools for analyzing resource timings and Web Vitals, which are crucial for understanding and optimizing your application's performance.
-
资源计时仪表板:此仪表板概述了在网页上加载各种资源所需的时间。您可以看到:
- 不同类型资源(JS、CSS、图像等)的加载时间
- 每种资源花费在 DNS 查找、TCP 连接、TLS 协商等方面的时间
- 可视化有助于识别加载过程中加载缓慢的资源或瓶颈
-
Web Vitals 指标:突出显示跟踪并显示关键的 Web Vitals 指标,包括:
- 最大内容绘制 (LCP):衡量加载性能
- 首次输入延迟 (FID):测量交互性
- 累积布局偏移 (CLS):测量视觉稳定性
- 首次内容绘制 (FCP):测量从导航到浏览器呈现第一位内容的时间
-
性能趋势:突出显示可让您随着时间的推移跟踪这些指标,帮助您识别:
- 代码更改或部署对性能的影响
- 可能会被忽视的逐渐退化
- 优化工作带来的改进
-
细分和过滤:您可以根据各种因素细分和过滤这些指标,例如:
- 设备类型(移动设备、桌面设备、平板电脑)
- 浏览器
- 地理位置
- 您定义的自定义属性
通过将详细的跟踪数据与这些高级性能指标相结合,您可以全面了解应用程序的性能。这使您能够快速识别问题、了解其根本原因并衡量优化工作的影响。
结论
OpenTelemetry 提供了用于监控和优化浏览器应用程序的强大工具。通过利用 Highlight 的 OpenTelemetry 集成,开发人员可以通过最少的配置收集可操作的见解。
无论您是在处理客户端性能问题、服务器端瓶颈,还是跨多个服务的复杂用户旅程,OpenTelemetry 和 Highlight 都能为您提供交付卓越 Web 应用程序所需的可见性。
以上是使用 OpenTelemetry 监控浏览器应用程序的详细内容。更多信息请关注PHP中文网其他相关文章!

 在JavaScript中替换字符串字符Mar 11, 2025 am 12:07 AM
JavaScript字符串替换方法详解及常见问题解答 本文将探讨两种在JavaScript中替换字符串字符的方法:在JavaScript代码内部替换和在网页HTML内部替换。 在JavaScript代码内部替换字符串 最直接的方法是使用replace()方法: str = str.replace("find","replace"); 该方法仅替换第一个匹配项。要替换所有匹配项,需使用正则表达式并添加全局标志g: str = str.replace(/fi
 构建您自己的Ajax Web应用程序Mar 09, 2025 am 12:11 AM
因此,在这里,您准备好了解所有称为Ajax的东西。但是,到底是什么? AJAX一词是指用于创建动态,交互式Web内容的一系列宽松的技术。 Ajax一词,最初由Jesse J创造

 如何在浏览器中优化JavaScript代码以进行性能?Mar 18, 2025 pm 03:14 PM
本文讨论了在浏览器中优化JavaScript性能的策略,重点是减少执行时间并最大程度地减少对页面负载速度的影响。
 如何使用浏览器开发人员工具有效调试JavaScript代码?Mar 18, 2025 pm 03:16 PM
本文讨论了使用浏览器开发人员工具的有效JavaScript调试,专注于设置断点,使用控制台和分析性能。
 jQuery矩阵效果Mar 10, 2025 am 12:52 AM
将矩阵电影特效带入你的网页!这是一个基于著名电影《黑客帝国》的酷炫jQuery插件。该插件模拟了电影中经典的绿色字符特效,只需选择一张图片,插件就会将其转换为充满数字字符的矩阵风格画面。快来试试吧,非常有趣! 工作原理 插件将图片加载到画布上,读取像素和颜色值: data = ctx.getImageData(x, y, settings.grainSize, settings.grainSize).data 插件巧妙地读取图片的矩形区域,并利用jQuery计算每个区域的平均颜色。然后,使用
 如何构建简单的jQuery滑块Mar 11, 2025 am 12:19 AM
本文将引导您使用jQuery库创建一个简单的图片轮播。我们将使用bxSlider库,它基于jQuery构建,并提供许多配置选项来设置轮播。 如今,图片轮播已成为网站必备功能——一图胜千言! 决定使用图片轮播后,下一个问题是如何创建它。首先,您需要收集高质量、高分辨率的图片。 接下来,您需要使用HTML和一些JavaScript代码来创建图片轮播。网络上有很多库可以帮助您以不同的方式创建轮播。我们将使用开源的bxSlider库。 bxSlider库支持响应式设计,因此使用此库构建的轮播可以适应任何
 如何使用Angular上传和下载CSV文件Mar 10, 2025 am 01:01 AM
数据集对于构建API模型和各种业务流程至关重要。这就是为什么导入和导出CSV是经常需要的功能。在本教程中,您将学习如何在Angular中下载和导入CSV文件


热AI工具

Undresser.AI Undress
人工智能驱动的应用程序,用于创建逼真的裸体照片

AI Clothes Remover
用于从照片中去除衣服的在线人工智能工具。

Undress AI Tool
免费脱衣服图片

Clothoff.io
AI脱衣机

AI Hentai Generator
免费生成ai无尽的。

热门文章
热工具

VSCode Windows 64位 下载
微软推出的免费、功能强大的一款IDE编辑器

WebStorm Mac版
好用的JavaScript开发工具

DVWA
Damn Vulnerable Web App (DVWA) 是一个PHP/MySQL的Web应用程序,非常容易受到攻击。它的主要目标是成为安全专业人员在合法环境中测试自己的技能和工具的辅助工具,帮助Web开发人员更好地理解保护Web应用程序的过程,并帮助教师/学生在课堂环境中教授/学习Web应用程序安全。DVWA的目标是通过简单直接的界面练习一些最常见的Web漏洞,难度各不相同。请注意,该软件中

SecLists
SecLists是最终安全测试人员的伙伴。它是一个包含各种类型列表的集合,这些列表在安全评估过程中经常使用,都在一个地方。SecLists通过方便地提供安全测试人员可能需要的所有列表,帮助提高安全测试的效率和生产力。列表类型包括用户名、密码、URL、模糊测试有效载荷、敏感数据模式、Web shell等等。测试人员只需将此存储库拉到新的测试机上,他就可以访问到所需的每种类型的列表。

Atom编辑器mac版下载
最流行的的开源编辑器

