


PHPStorm怎么通过配置 XDebug 调试本地代码或远程调试服务器上的 PHP 代码?下面本篇文章就来带大家了解一下配置方法,希望对大家有所帮助!

1、PHP 配置
为 PHP 安装 xdebug, 方法略
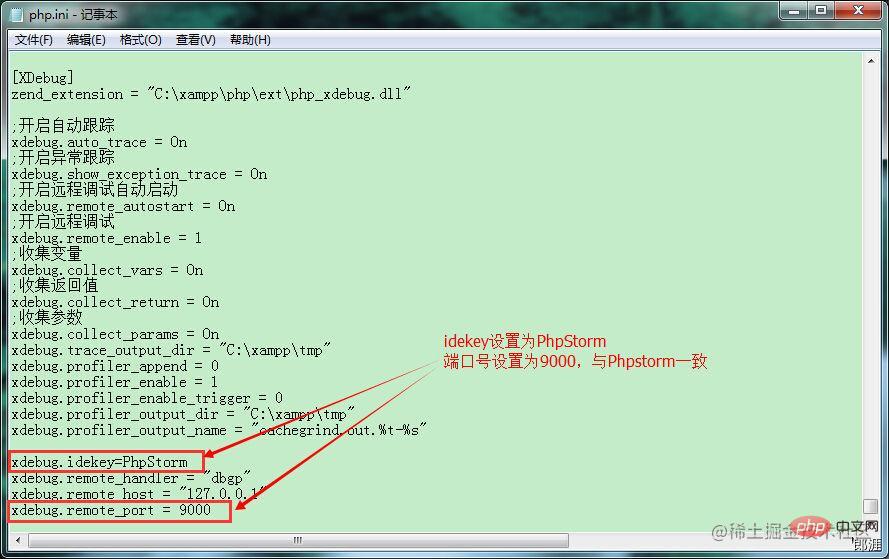
配置文件 php.ini
[XDebug]zend_extension = "/opt/lampp/lib/php/extensions/no-debug-non-zts-20131226/xdebug.so";开启自动跟踪xdebug.auto_trace = 1;开启异常跟踪xdebug.show_exception_trace = 0;开启远程调试自动启动xdebug.remote_autostart = 1;开启远程调试xdebug.remote_enable = 1xdebug.remote_connect_back = 1xdebug.max_nesting_level = 250;收集变量xdebug.collect_vars = 1;收集返回值xdebug.collect_return = 1;收集参数xdebug.collect_params = 1xdebug.trace_output_dir = "/opt/lampp/tmp"xdebug.profiler_append = 0xdebug.profiler_enable = 1xdebug.profiler_enable_trigger = 0xdebug.profiler_output_dir = "/opt/lampp/tmp"xdebug.profiler_output_name = "cachegrind.out.%t-%s"xdebug.idekey=PHPSTORMxdebug.remote_handler = "dbgp"xdebug.remote_host = localhostxdebug.remote_port = 9000复制代码
2、phpstorm 配置
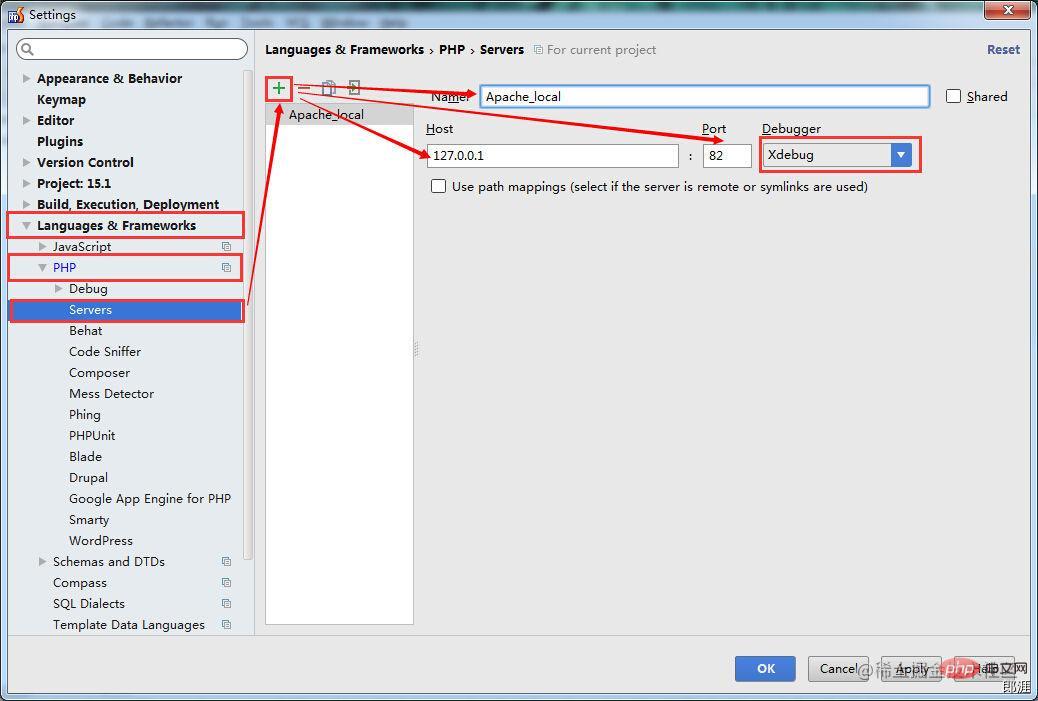
File>Settings>Languages&Frameworks>PHP>Servers
添加一个 Server(设置 Web 服务器的Host、Port 等信息)
注意:
要想调试远程服务器上的代码,需要使用 use path mappings:
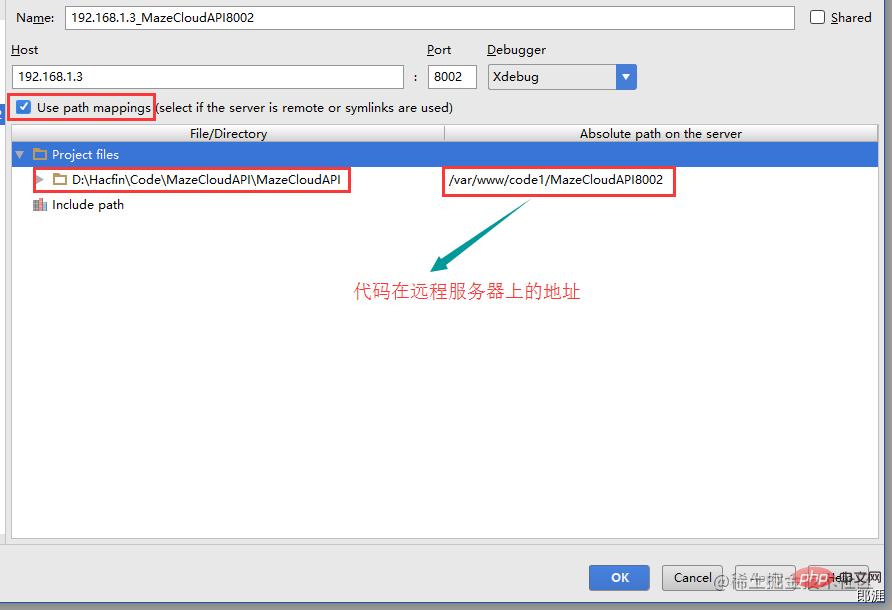
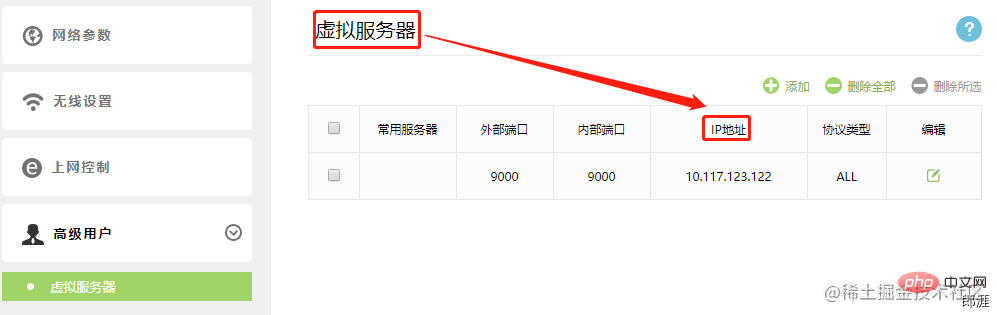
如果远程服务器与本机不在同一个路由器下,例如本机为 10.117.123.122(隶属于路由器 A),远程服务器为 192.168.123.100(隶属于路由器 B)。这时候想用 Xdebug 进行调试,就需要配置本机 IDE 所在的路由器的端口映射,将 9000 映射到本机。
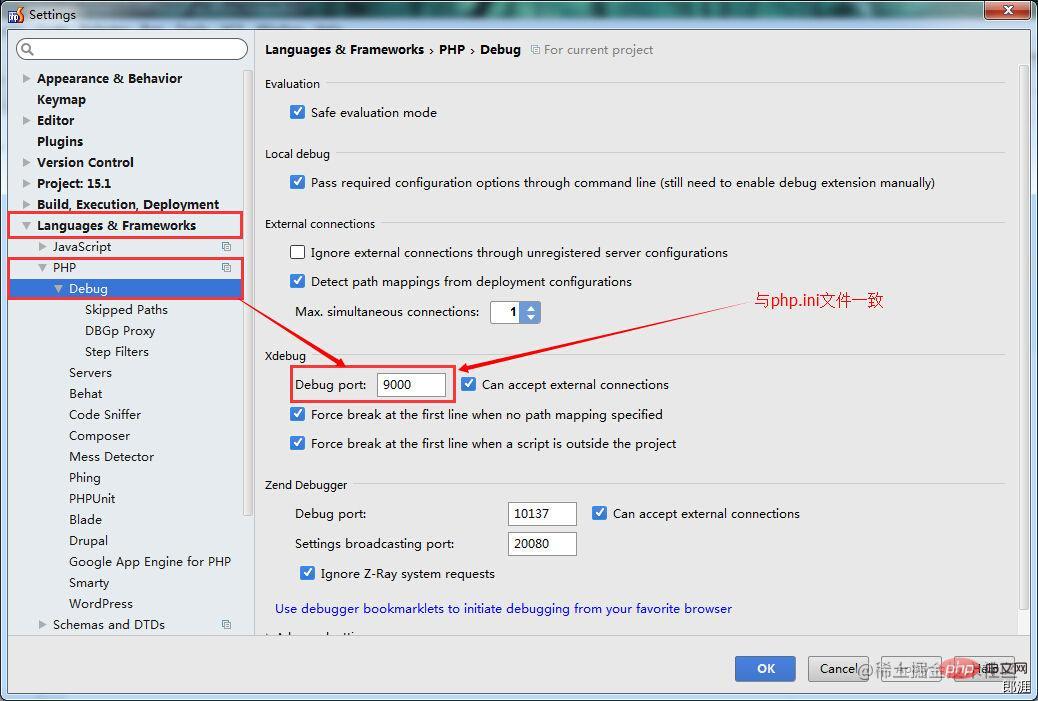
File>Settings>Languages&Frameworks>PHP>Debug
看到 XDebug 选项卡,port 填9000,其他默认。
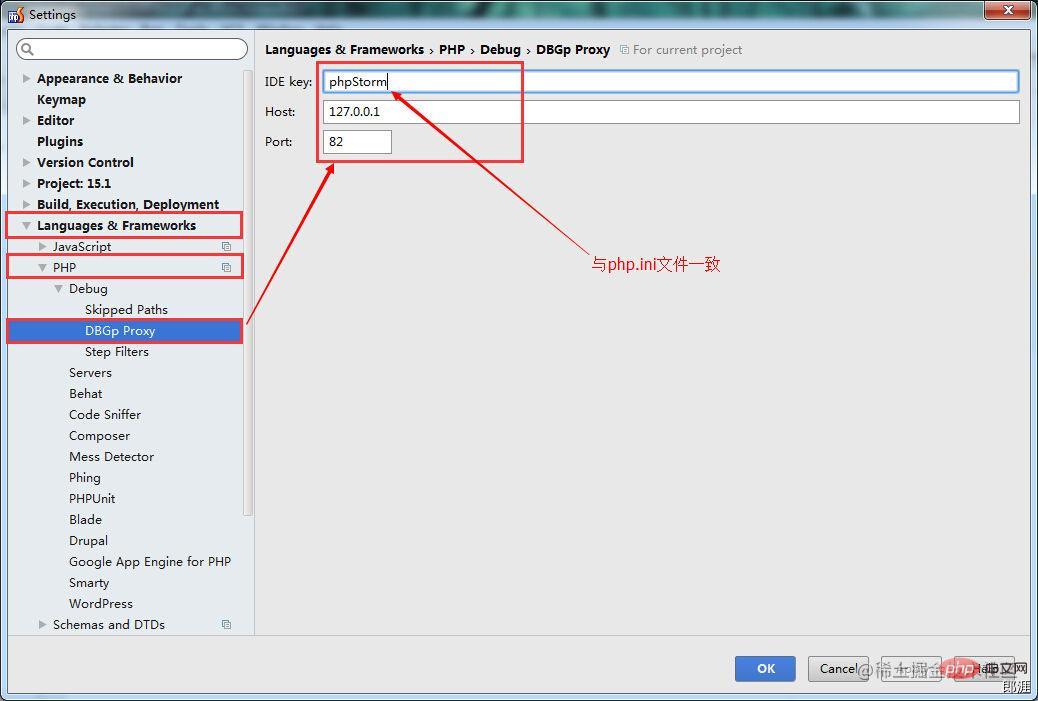
File>Settings>Languages&Frameworks>PHP>Debug>DBGp Proxy
IDE key 填 PhpStorm (host 填 localhost,port 填 9000)
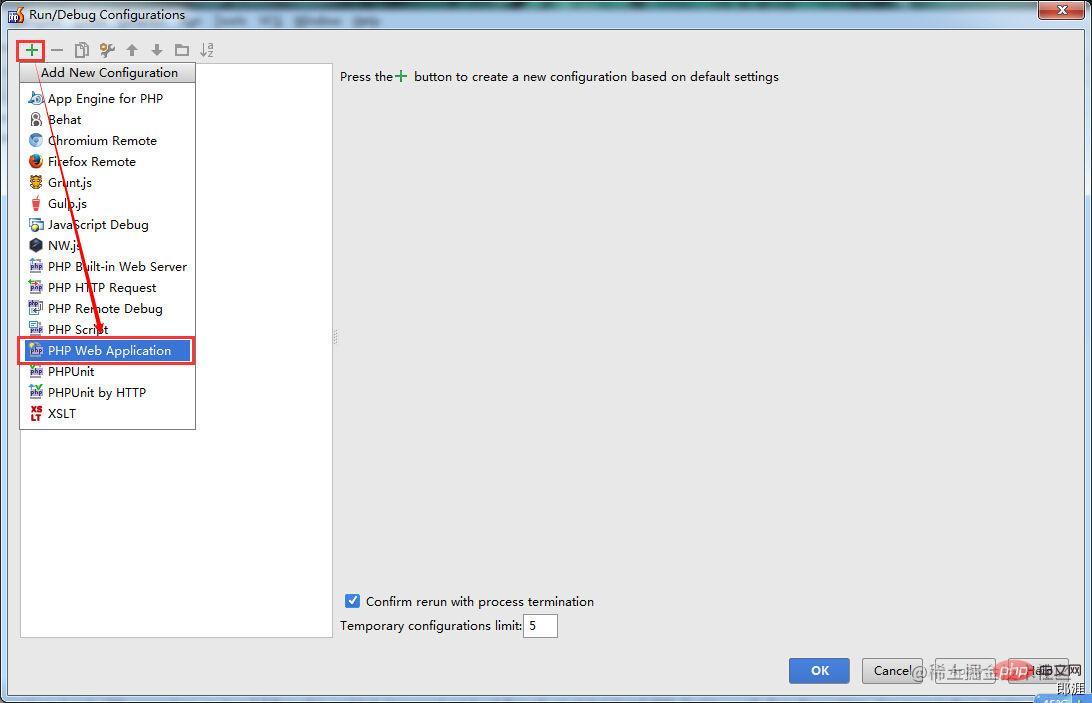
Run>Edit Configurations
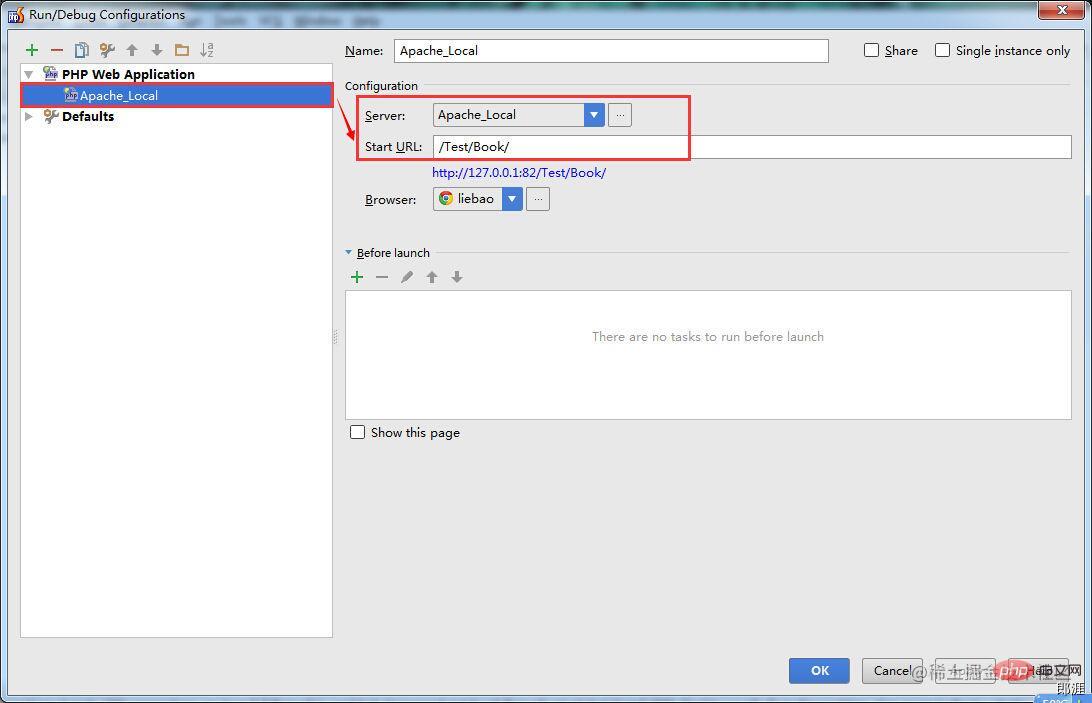
添加 Web 调试服务器
启动监听
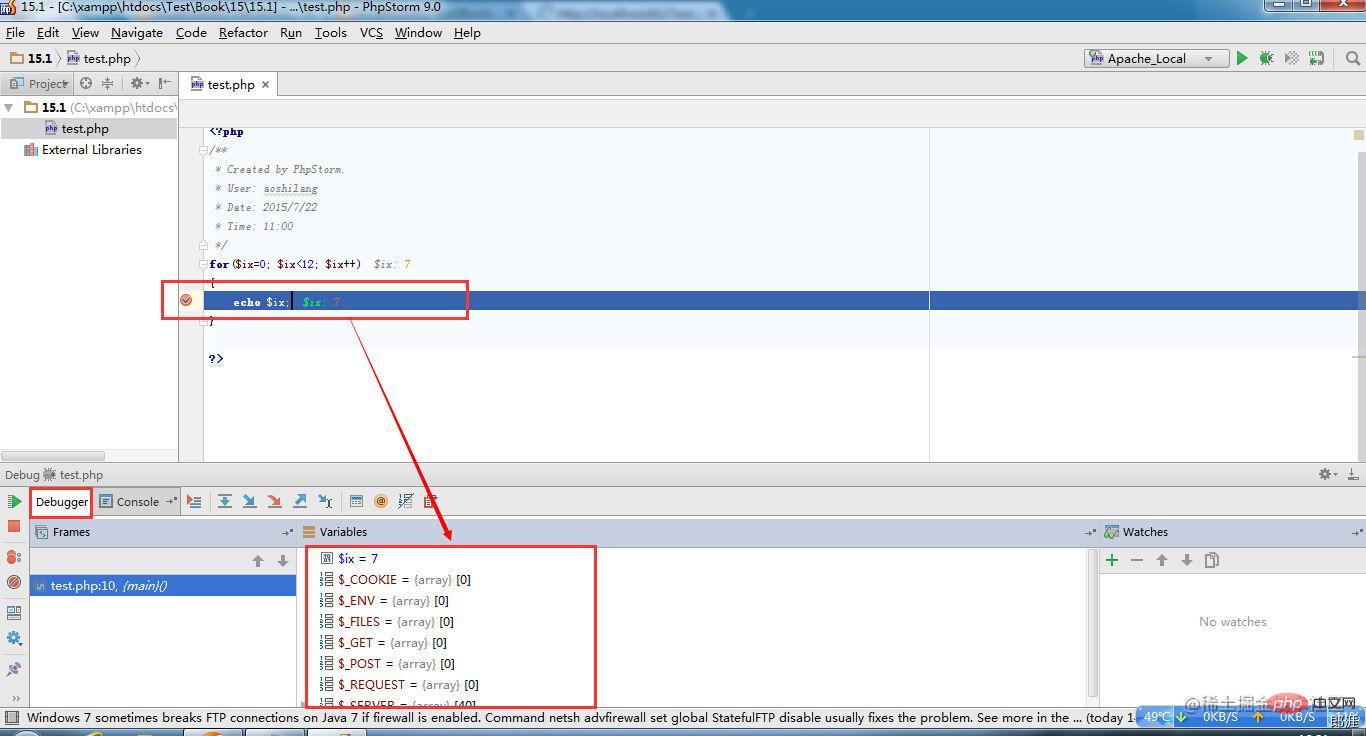
在phpstorm中设置断点后,启动监听,就是电话一样的图标。用 chrome 浏览 localhost 中的指定断点的文件,会自动进入断点,在 phpstorm 中看到调试信息。
如果执行完上述步骤后,还不行。确认下本机的防火墙是否开放对应端口(或者直接关闭本机防火墙)
推荐学习:《phpstorm使用教程》

热AI工具

Undresser.AI Undress
人工智能驱动的应用程序,用于创建逼真的裸体照片

AI Clothes Remover
用于从照片中去除衣服的在线人工智能工具。

Undress AI Tool
免费脱衣服图片

Clothoff.io
AI脱衣机

Video Face Swap
使用我们完全免费的人工智能换脸工具轻松在任何视频中换脸!

热门文章
热工具

WebStorm Mac版
好用的JavaScript开发工具

SublimeText3 Linux新版
SublimeText3 Linux最新版

MinGW - 适用于 Windows 的极简 GNU
这个项目正在迁移到osdn.net/projects/mingw的过程中,你可以继续在那里关注我们。MinGW:GNU编译器集合(GCC)的本地Windows移植版本,可自由分发的导入库和用于构建本地Windows应用程序的头文件;包括对MSVC运行时的扩展,以支持C99功能。MinGW的所有软件都可以在64位Windows平台上运行。

SublimeText3汉化版
中文版,非常好用

SublimeText3 Mac版
神级代码编辑软件(SublimeText3)

