如何使用 Material UI 和 Devexpress 在 React 中建立長條圖?
- PHPz轉載
- 2023-09-15 23:49:01846瀏覽
Material UI 是一個受歡迎的 CSS 函式庫,我們可以用它來設計 React 應用程式的樣式。它包含各種預先設計樣式的 React 元件,我們可以透過將它們匯入到程式碼中來直接在應用程式中使用它們。
‘dx-react-chart-material-ui’是Devexpress的一個NPM包,可以連接devexpress的material-ui和‘dx-react-chart’庫。 「dx-react-chart」用於建立圖表,Material UI 用於設定圖表樣式。
使用者可以執行以下命令在React應用程式中安裝Material UI。
npm install @mui/material @emotion/react @emotion/styled
此外,執行以下命令來安裝 Devexpress NPM 套件。
npm i @devexpress/dx-react-chart
文法
使用者可以依照以下語法使用 Devexpress 建立長條圖。
<Chart data = {data}>
   <BarSeries valueField = "price" argumentField = "fruit" />
   <Title text = "Fruit price" />
</Chart>
在上面的語法中,我們使用了 DevExpress 的「Chart」、「BarSeries」和「Title」元件。 “Chart”組件顯示圖表,“BarSeries”組件顯示條形圖,“Title”組件顯示標題。
範例 1(簡單長條圖)
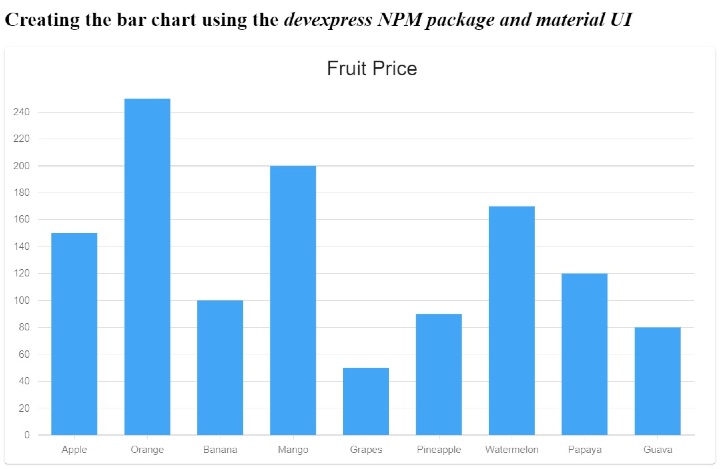
在下面的範例中,我們從 Material UI 匯入了「Paper」元件。此外,我們也從「devexpress」NPM 套件中導入了所需的元件。
我們也定義了包含圖表資料的 data[] 陣列。它包含水果的名稱和價格。我們創建一個簡單的長條圖來比較水果價格。在輸出中,使用者可以觀察條形圖。
import React, { useState } from "react";
import Paper from "@mui/material/Paper";
import {
   Chart,
   BarSeries,
   Title,
   ArgumentAxis,
   ValueAxis,
} from "@devexpress/dx-react-chart-material-ui";
import { Animation } from "@devexpress/dx-react-chart";

const data = [
   { fruit: "Apple", price: 150 },
   { fruit: "Orange", price: 250 },
   { fruit: "Banana", price: 100 },
   { fruit: "Mango", price: 200 },
   { fruit: "Grapes", price: 50 },
   { fruit: "Pineapple", price: 90 },
   { fruit: "Watermelon", price: 170 },
   { fruit: "Papaya", price: 120 },
   { fruit: "Guava", price: 80 },
];

function App() {
   return (
      <div>
         <h2>
            Creating the{" "}
            bar chart using the <i>  devexpress NPM   package and material UI </i>
         </h2>
         <Paper>
            <Chart data = {data}>
               <ArgumentAxis />
               <ValueAxis max = {200} />
               <BarSeries valueField = "price" argumentField = "fruit" />
               <Title text = "Fruit Price" />
               <Animation />
            </Chart>
         </Paper>
      </div>
   );
}
export default App;
輸出

#範例 2(並排長條圖)
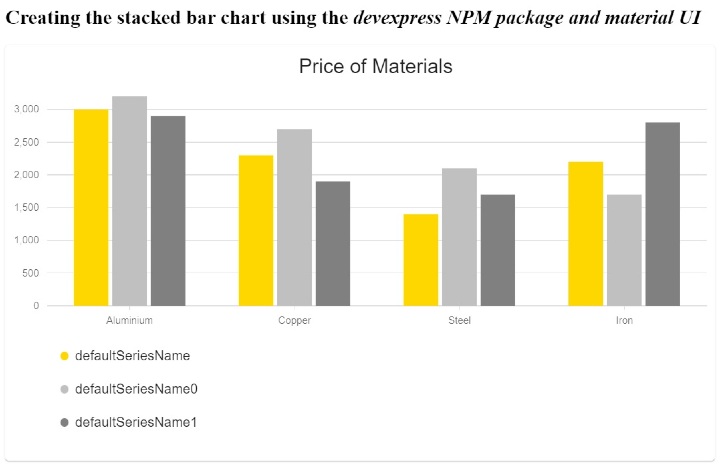
在下面的範例中,我們示範如何建立並排長條圖。此數據包含根據顏色的材料名稱和價格。
此圖表包含單一材料的一系列 3 個長條圖,每個長條圖代表不同的顏色。我們使用“Barseries”組件為每種材料建立一個條形。此外,我們還設定了組件的標題。
在輸出中,使用者可以觀察並排的長條圖,每個長條根據顏色比較不同材質的價格。
import React from "react";
import Paper from "@mui/material/Paper";
import {
   Chart,
   BarSeries,
   Title,
   ArgumentAxis,
   ValueAxis,
   Legend,
} from "@devexpress/dx-react-chart-material-ui";
import { Stack, Animation } from "@devexpress/dx-react-chart";

const chartData = [
   { material: "Aluminium", yellow: 3000, silver: 3200, grey: 2900 },
   { material: "Copper", yellow: 2300, silver: 2700, grey: 1900 },
   { material: "Steel", yellow: 1400, silver: 2100, grey: 1700 },
   { material: "Iron", yellow: 2200, silver: 1700, grey: 2800 },
];

function App() {
  return (
      <div>
      <h2>
         Creating the{" "}
         stacked bar chart using the <i> devexpress NPM package and material UI </i>
      </h2>
      <Paper>
         <Chart data = {chartData}>
            <ArgumentAxis />
            <ValueAxis />

            <BarSeries
               Name = "yellow color"
               valueField = "yellow"
               argumentField = "material"
               color = "#ffd700"
            />
            <BarSeries
               Name = "Silver color"
               valueField = "silver"
               argumentField = "material"
               color = "#c0c0c0"
            />
            <BarSeries
               Name = "grey color"
               valueField = "grey"
               argumentField = "material"
               color = "grey"
            />
            <Animation />
            <Legend position = "bottom" />
            <Title text = "Price of Materials" />
            <Stack />
         </Chart>
         </Paper>
      </div>
   );
}
export default App;
輸出

#範例 3(堆疊長條圖)
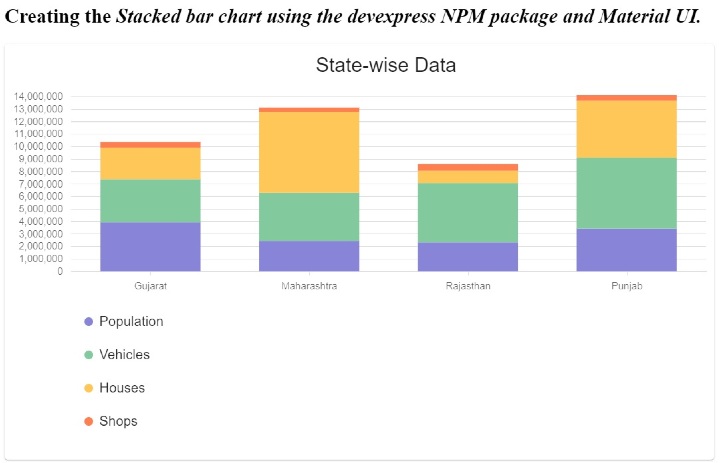
在下面的範例中,我們示範如何建立堆積長條圖。我們根據各州準備了人口、車輛、房屋和商店數據,以建立條形圖。
在下面的範例中,我們示範如何建立堆積長條圖。我們根據各州準備了人口、車輛、房屋和商店數據,以建立條形圖。
import React from "react";
import Paper from "@mui/material/Paper";
import {
   Chart,
   BarSeries,
   Title,
   ArgumentAxis,
   ValueAxis,
   Legend,
} from "@devexpress/dx-react-chart-material-ui";
import { Stack, Animation } from "@devexpress/dx-react-chart";

const chartData = [
   { state: "Gujarat", population: 3938223, vehicles: 3456800, houses: 2535447, shops: 454464 },
   { state: "Maharashtra", population: 2446456, vehicles: 3864500, houses: 6485534, shops: 344654 },
   { state: "Rajasthan", population: 2332543, vehicles: 4756549, houses: 981496, shops: 545621 },
   { state: "Punjab", population: 3434657, vehicles: 5686564, houses: 4569847, shops: 448734 },
];

function App() {
   return (
      <div>
         <h2>
            Creating the{" "}
            <i>
               Stacked bar chart using the devexpress NPM package and Material UI.
            </i>
         </h2>
         <Paper>
            <Chart data = {chartData}>
               <ArgumentAxis />
               <ValueAxis max = {50000000} />

               <BarSeries
                  name = "Population"
                  valueField = "population"
                  argumentField = "state"
                  color = "#8884d8"
               />
               <BarSeries
                  name = "Vehicles"
                  valueField = "vehicles"
                  argumentField = "state"
                  color = "#82ca9d"
               />
               <BarSeries
                  name = "Houses"
                  valueField = "houses"
                  argumentField = "state"
                  color = "#ffc658"
               />
               <BarSeries
                  name = "Shops"
                  valueField = "shops"
                  argumentField = "state"
                  color = "#ff7f50"
               />
               <Animation />
               <Legend position = "bottom" />
               <Title text = "State-wise Data" />
               <Stack stacks = {[{ series: ["Population", "Vehicles", "Houses", "Shops"] }]} />
            </Chart>
         </Paper>
      </div>
   );
}

export default App;
輸出

#我們學習了使用 Devexpress 和 Material UI 函式庫來建立和設計圖表。 Devexpress NPM 套件是 Material UI 和 Devexpress 圖表庫之間的橋樑。此外,我們在本教程中學習了創建各種類型的長條圖。
以上是如何使用 Material UI 和 Devexpress 在 React 中建立長條圖?的詳細內容。更多資訊請關注PHP中文網其他相關文章!

